Inflation Rate in India (1960–2025) – Trends & Data
Inflation rate in India stood at 3.34% in March 2025, marking the lowest level in six years—the lowest since the pre-COVID era. This significant decline reflects the effectiveness of the Reserve Bank of India’s (RBI) inflation control policies. Inflation fell by 27 basis points from 3.61% in February 2025 to 3.34% in March.
In India, inflation is measured by the Consumer Price Index (CPI), which tracks the increase in prices of goods and services across the economy. A rising CPI indicates a reduction in the purchasing power of money, affects consumers.
Inflation Rate in India in March 2025
Key inflation highlights for March 2025 vs February 2025
| Inflation rate | March, 2025 | February 2025 |
|---|---|---|
| Headline inflation(Urban) | 3.43% | 3.32% |
| Food Inflation (Urban) | 2.48% | 3.15% |
| Headline inflation(Rural) | 3.25% | 3.79% |
| Food Inflation (Rural) | 2.82% | 4.06% |
| Housing Inflation | 3.03% | 2.91% |
| Fuel & Light | 1.48% | -1.33% |
| Health Inflation | 4.26% | 4.12% |
| Transport & Communication | 3.3% | 2.93% |
| Education Inflation | 3.98% | 3.83% |
Read also: Brain Drain: How many People Left India from 1960 to 2025
Inflation Chart, India
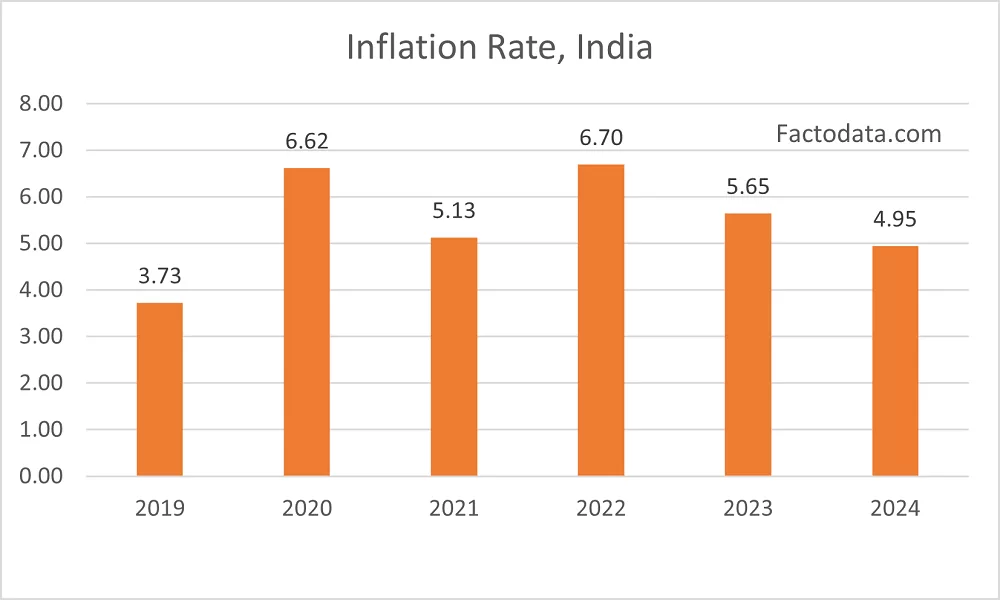
Inflation has been declining for last 3 year, falling from 6.7 percent in 2022–23 to 5.4 percent in 2023–24, and further to 4.6 percent in 2024–25.
Read also: India’s Forex Reserves : 2025
Inflation rate from 1960 to 2024
Source: World bank, MOSPI