India’s Merchandise Exports (1985–2025): A 40-Year Growth Story in Global Trade
India’s total merchandise exports reached $437.4 billion in 2024-25, a growth of 0.08% compared to $437.04 billion in 2023–24. As per RBI data, India’s exports have nearly doubled from $468 billion in 2014-15. India Exports goods and services to approx 200 countries around the world.
In FY 2024–25, total exports of India, comprising both merchandise and services reached an all time high of $820.9 billion, reflecting the country’s growing role in global trade.
- Merchandise Exports: $437.4 billion (53.3% of total exports)
- Service Exports: $383.5 billion (46.7% of total exports)
Read also: India US Trade Statistics 2025: Sector-Wise Analysis & Growth Insights
Top 5 Exported Products from India
Engineering goods led the chart with $116.54 billion, making up nearly 27% of total exports, reflecting India’s growing manufacturing base. Other major contributors included petroleum products ($60.07B), electronic goods ($38.55B), and pharmaceuticals ($30.37B), highlighting India’s strength in energy, technology, and healthcare sectors.
- Engineering Goods: $116.54 billion (26.88% of total exports)
- Petroleum Products: $60.07 billion (13.86%)
- Electronic Goods: $38.55 billion (8.89%)
- Drugs and Pharmaceuticals: $30.37 billion (7.01%)
- Gems and Jewellery: $29.80 billion (6.87%)
Indian Export Milestones
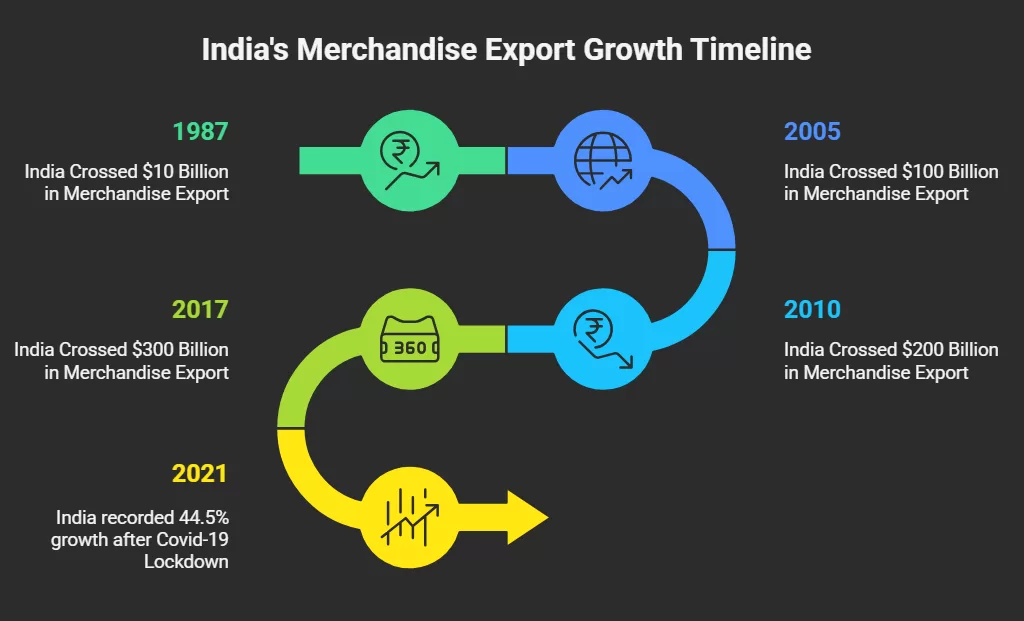
- 1987: India Crossed $10 Billion in Merchandise Export.
- 2005: India Crossed $100 Billion in Merchandise Export.
- 2010: India Crossed $200 Billion in Merchandise Export.
- 2017: India Crossed $300 Billion in Merchandise Export.
- 2021: India recorded 44.5% growth after Covid-19 Lockdown.
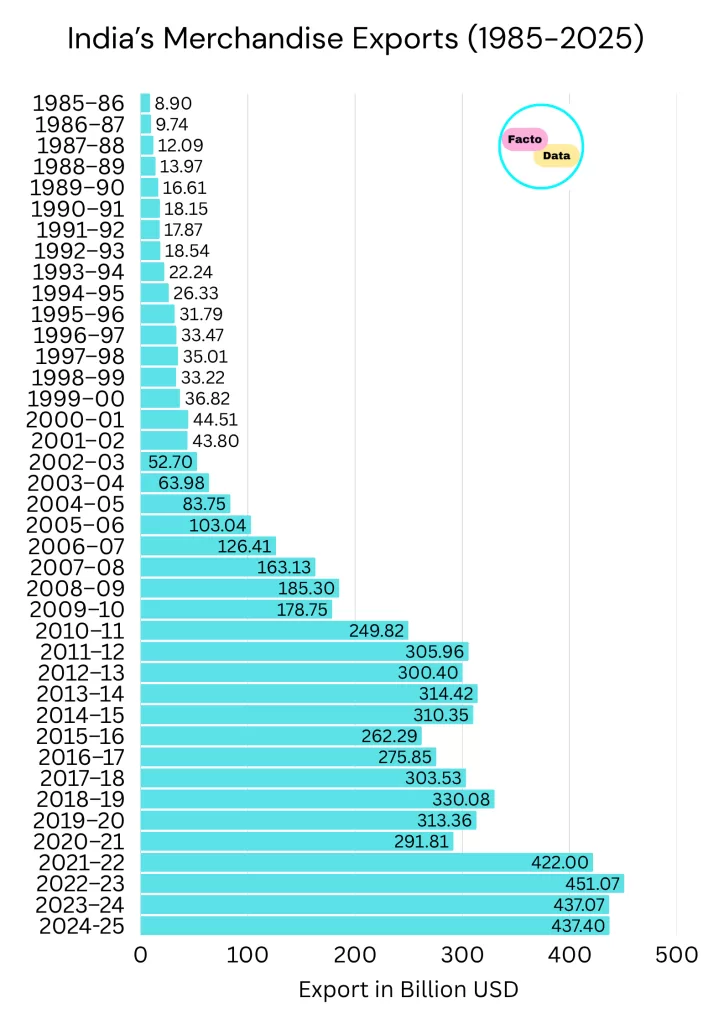
India’s Merchandise Export from 1985 to 2025
| Year | Merchandise Export (USD Billion) | YoY Growth (%) |
|---|---|---|
| 1985–86 | 8.9 | - |
| 1986–87 | 9.74 | 9.44% |
| 1987–88 | 12.09 | 24.14% |
| 1988–89 | 13.97 | 15.57% |
| 1989–90 | 16.61 | 18.91% |
| 1990–91 | 18.15 | 9.27% |
| 1991–92 | 17.87 | -1.54% |
| 1992–93 | 18.54 | 3.74% |
| 1993–94 | 22.24 | 19.95% |
| 1994–95 | 26.33 | 18.39% |
| 1995–96 | 31.79 | 20.75% |
| 1996–97 | 33.47 | 5.27% |
| 1997–98 | 35.01 | 4.61% |
| 1998–99 | 33.22 | -5.12% |
| 1999–00 | 36.82 | 10.83% |
| 2000–01 | 44.51 | 20.89% |
| 2001–02 | 43.8 | -1.59% |
| 2002–03 | 52.7 | 20.35% |
| 2003–04 | 63.98 | 21.39% |
| 2004–05 | 83.75 | 30.91% |
| 2005–06 | 103.04 | 23.01% |
| 2006–07 | 126.41 | 22.70% |
| 2007–08 | 163.13 | 29.09% |
| 2008–09 | 185.3 | 13.59% |
| 2009–10 | 178.75 | -3.53% |
| 2010–11 | 249.82 | 39.75% |
| 2011–12 | 305.96 | 22.49% |
| 2012–13 | 300.4 | -1.82% |
| 2013–14 | 314.42 | 4.67% |
| 2014–15 | 310.35 | -1.29% |
| 2015–16 | 262.29 | -15.47% |
| 2016–17 | 275.85 | 5.17% |
| 2017–18 | 303.53 | 10.02% |
| 2018–19 | 330.08 | 8.75% |
| 2019–20 | 313.36 | -5.06% |
| 2020–21 | 291.81 | -6.87% |
| 2021–22 | 422.00 | 44.59% |
| 2022–23 | 451.07 | 6.89% |
| 2023–24 | 437.07 | -3.11% |
| 2024-25 | 437.40 | 0.08% |