How Much Average Indian Eats: Latest State-wise Calorie Consumption Data
In India, the average daily calorie intake in 2024 was 2,212 kcal in rural areas and 2,240 kcal in urban areas, according to a report released by the Ministry of Statistics and Programme Implementation (MoSPI).
On a per‑consumer‑unit basis, the average calorie intake is 2,383 kcal in rural areas and 2,472 kcal in urban areas—within the ICMR/WHO recommended range of 2,200–2,500 kcal.
- Per Capita: Calories consumed per person on average.
- Per Consumer Unit: Adjusts for age and sex in the household to better reflect dietary needs.
How much India Eats
| Category | Calories/day |
|---|---|
| Rural (Per Capita) | 2212 kcal |
| Urban (Per Capita) | 2240 kcal |
| Rural (Per Consumer Unit) | 2383 kcal |
| Urban (Per Consumer Unit) | 2472 kcal |
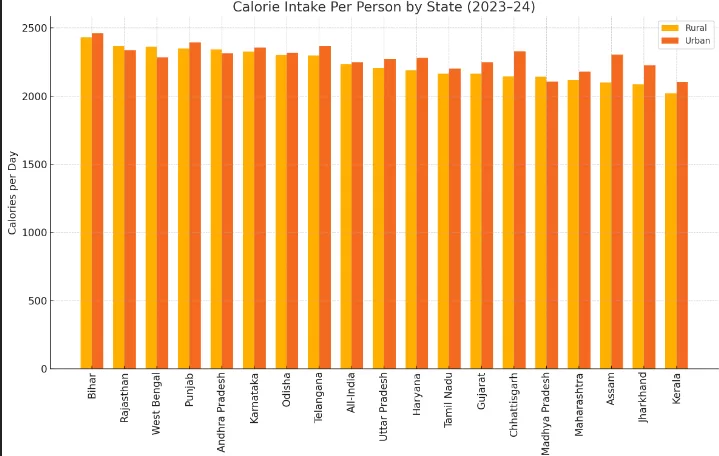
State-wise Calorie Intake in India
In 2023–24, Rajasthan led in rural per capita calorie intake, while Bihar topped the urban category. On a per consumer unit basis, Rajasthan again ranked highest in rural areas, and Bihar maintained its lead in urban regions.
Top 5 States – Rural (Per Capita Calorie Intake)
| Rank | State | Calories (Kcal) |
|---|---|---|
| 1 | Rajasthan | 2403 |
| 2 | Haryana | 2367 |
| 3 | Telangana | 2379 |
| 4 | Odisha | 2357 |
| 5 | Andhra Pradesh | 2340 |
Read also: Where Does India Have Military Bases Outside Its Borders?
Top 5 States – Urban (Per Capita Calorie Intake)
| Rank | State | Calories (Kcal) |
|---|---|---|
| 1 | Bihar | 2453 |
| 2 | Telangana | 2455 |
| 3 | Odisha | 2406 |
| 4 | Punjab | 2365 |
| 5 | Rajasthan | 2364 |
Read also: Busiest Airports in the World in 2025
Top 5 States – Rural (Per Consumer Unit Calorie Intake)
| Rank | State | Calories (Kcal) |
|---|---|---|
| 1 | Rajasthan | 2628 |
| 2 | Odisha | 2552 |
| 3 | Haryana | 2548 |
| 4 | Bihar | 2539 |
| 5 | Telangana | 2541 |
Read also: Top 10 Car Manufacturers by Market Cap in 2025: Tesla, Toyota
Top 5 States – Urban (Per Consumer Unit Calorie Intake)
| Rank | State | Calories (Kcal) |
|---|---|---|
| 1 | Bihar | 2719 |
| 2 | Telangana | 2699 |
| 3 | Odisha | 2653 |
| 4 | Rajasthan | 2621 |
| 5 | Chhattisgarh | 2621 |
Read also: Extreme Poverty in India: A Success Story in the Making
List of Indian states with Calorie Intake
| State | Rural (Per Capita) | Urban (Per Capita) | Rural (Per consumer) | Urban (Per consumer) |
|---|---|---|---|---|
| Andhra Pradesh | 2340 | 2285 | 2497 | 2510 |
| Assam | 2073 | 2310 | 2218 | 2548 |
| Bihar | 2326 | 2453 | 2539 | 2719 |
| Chhattisgarh | 2284 | 2366 | 2457 | 2621 |
| Gujarat | 2105 | 2310 | 2260 | 2541 |
| Haryana | 2367 | 2360 | 2548 | 2582 |
| Jharkhand | 2056 | 2165 | 2231 | 2379 |
| Karnataka | 2202 | 2289 | 2338 | 2517 |
| Kerala | 2121 | 2104 | 2292 | 2385 |
| Madhya Pradesh | 2089 | 2088 | 2248 | 2307 |
| Maharashtra | 2072 | 2110 | 2212 | 2321 |
| Odisha | 2357 | 2406 | 2552 | 2653 |
| Punjab | 2300 | 2365 | 2440 | 2595 |
| Rajasthan | 2403 | 2364 | 2628 | 2621 |
| Tamil Nadu | 2203 | 2304 | 2354 | 2540 |
| Telangana | 2379 | 2455 | 2541 | 2699 |
| Uttar Pradesh | 2086 | 2080 | 2258 | 2303 |
| West Bengal | 2278 | 2199 | 2438 | 2429 |
| All-India | 2212 | 2240 | 2383 | 2472 |
Source: MOSPI
States With lowest Calorie Intake
In rural areas, Jharkhand reported the lowest average calorie intake at 2,056 Kcal, while in urban areas, Uttar Pradesh had the lowest with just 2,080 Kcal.
Bottom 5 States – Rural (Per Capita Calorie Intake)
| Rank | State | Calories (Kcal) |
|---|---|---|
| 1 | Jharkhand | 2056 |
| 2 | Maharashtra | 2072 |
| 3 | Assam | 2073 |
| 4 | Uttar Pradesh | 2086 |
| 5 | Madhya Pradesh | 2089 |
Read also: Richest Cities In India, 2025: Full list by GDP(nominal)
Bottom 5 States – Urban(Per Capita Calorie Intake)
| Rank | State | Calories (Kcal) |
|---|---|---|
| 1 | Uttar Pradesh | 2080 |
| 2 | Madhya Pradesh | 2088 |
| 3 | Kerala | 2104 |
| 4 | Maharashtra | 2110 |
| 5 | Jharkhand | 2165 |