India GDP Growth Over the Year: Key Milestones & Future Projections(1960-2025)
India GDP in 2025 has experienced tremendous growth over the decades. In 2023, India’s GDP reached $3.55 trillion, according to World Bank data, with an impressive 7.58% growth rate, making it the fastest-growing major economy.
India’s GDP is projected to reach $3.88 trillion in 2024, with an estimated growth rate of 6.2%. This marks a significant leap from 1960, when India’s GDP was just $37 billion.
By 2027, India is expected to achieve a $5 trillion economy, and it will become the world’s third-largest economy by GDP.
GDP of India: Key Milestones & Future Projections
India’s GDP growth has been remarkable over the decades, reflecting its rapid economic transformation:
- 1960: India’s GDP was just $37 billion.
- 1976: GDP crossed the $100 billion mark.
- 2007: India’s economy reached the $1 trillion milestone.
- 2014: GDP doubled to $2 trillion.
- 2021: India’s GDP crossed $3 trillion.
- 2027 (Projected): India is expected to become a $5 trillion economy, ranking among the world’s top three economies.
- .
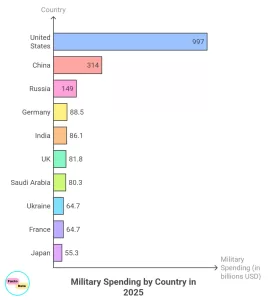
India’s rank by GDP
India is on the 5th rank in the world by GDP in 2023 and will reach the 3rd position, only behind the US and China.
- USA
- China
- Germany
- Japan
- India
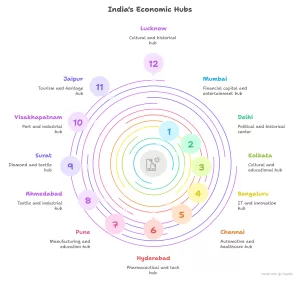
States like Maharashtra, Tamil Nadu, Uttar Pradesh, Karnataka, and Gujarat contribute the most to India’s economy. Meanwhile, the Indian government is investing heavily in infrastructure to boost the country’s GDP.
GDP of India from 1960 to 2024
| Year | GDP($) current prices | % Growth Rate(annual) |
|---|---|---|
| 1960 | 37.0B | |
| 1961 | 39.2B | 3.72 |
| 1962 | 42.2B | 2.93 |
| 1963 | 48.4B | 5.99 |
| 1964 | 56.5B | 7.45 |
| 1965 | 59.6B | -2.64 |
| 1966 | 45.6B | -0.06 |
| 1967 | 50.1B | 7.83 |
| 1968 | 53.1B | 3.39 |
| 1969 | 58.4B | 6.54 |
| 1970 | 62.4B | 5.16 |
| 1971 | 67.4B | 1.64 |
| 1972 | 71.5B | -0.55 |
| 1973 | 85.5B | 3.30 |
| 1974 | 99.5B | 1.19 |
| 1975 | 98.5B | 9.15 |
| 1976 | 102.7B | 1.66 |
| 1977 | 121.5B | 7.25 |
| 1978 | 137.3B | 5.71 |
| 1979 | 153.0B | -5.24 |
| 1980 | 186.3B | 6.74 |
| 1981 | 193.5B | 6.01 |
| 1982 | 200.7B | 3.48 |
| 1983 | 218.3B | 7.29 |
| 1984 | 212.2B | 3.82 |
| 1985 | 232.5B | 5.25 |
| 1986 | 249.0B | 4.78 |
| 1987 | 279.0B | 3.97 |
| 1988 | 296.6B | 9.63 |
| 1989 | 296.0B | 5.95 |
| 1990 | 321.0B | 5.53 |
| 1991 | 270.1B | 1.06 |
| 1992 | 288.2B | 5.48 |
| 1993 | 279.3B | 4.75 |
| 1994 | 327.3B | 6.66 |
| 1995 | 360.3B | 7.57 |
| 1996 | 392.9B | 7.55 |
| 1997 | 415.9B | 4.05 |
| 1998 | 421.4B | 6.18 |
| 1999 | 458.8B | 8.85 |
| 2000 | 468.4B | 3.84 |
| 2001 | 485.4B | 4.82 |
| 2002 | 514.9B | 3.80 |
| 2003 | 607.7B | 7.86 |
| 2004 | 709.2B | 7.92 |
| 2005 | 820.4B | 7.92 |
| 2006 | 940.3B | 8.06 |
| 2007 | 1.22T | 7.66 |
| 2008 | 1.20T | 3.09 |
| 2009 | 1.34T | 7.86 |
| 2010 | 1.68T | 8.50 |
| 2011 | 1.82T | 5.24 |
| 2012 | 1.83T | 5.46 |
| 2013 | 1.86T | 6.39 |
| 2014 | 2.04T | 7.41 |
| 2015 | 2.10T | 8.00 |
| 2016 | 2.29T | 8.26 |
| 2017 | 2.65T | 6.80 |
| 2018 | 2.70T | 6.45 |
| 2019 | 2.84T | 3.87 |
| 2020 | 2.67T | -5.78 |
| 2021 | 3.17T | 9.69 |
| 2022 | 3.35T | 6.99 |
| 2023 | 3.57T | 7.58 |
| 2024 | 3.88(est.) | 6.88 |
Note – Annual percentage growth rate of GDP at market prices based on constant local currency. Aggregates are based on constant 2015 prices, expressed in U.S. dollars.
Data Source: World Bank