Fertility rate In India, 1950 to 2024
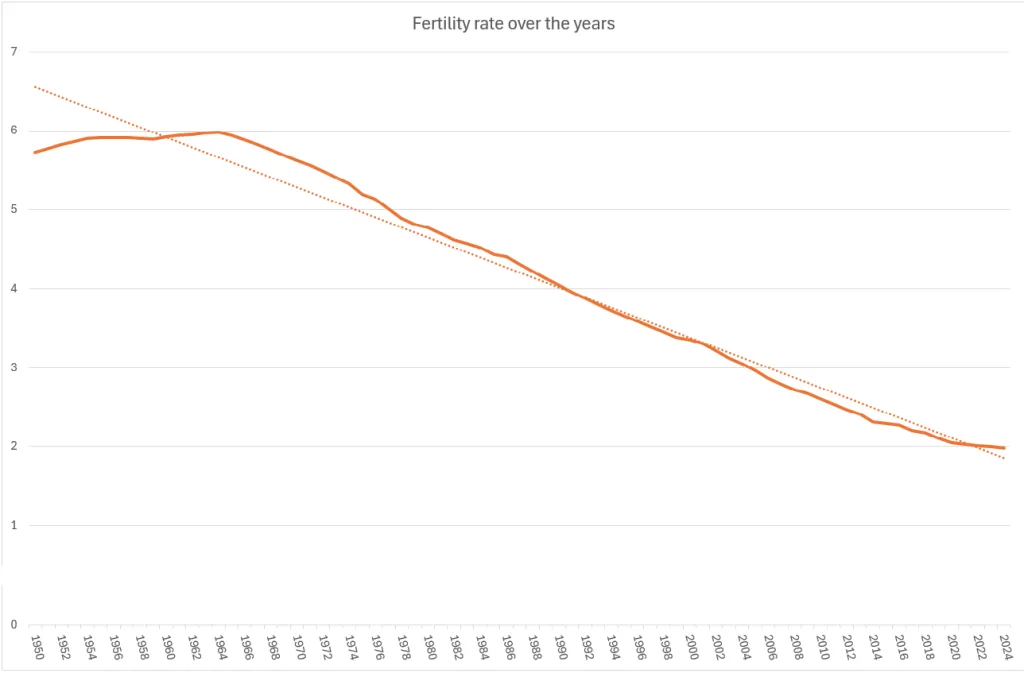
The Fertility rate in India has been steadily declining over the year, in 2024 it was 1.98 children per woman as per UN data.
The total fertility rate (TFR) is a demographic measure that estimates the average number of children a woman would have over her lifetime.
A total fertility rate (TFR) of about 2.1 children per woman is called the “replacement level.” This is the number needed to keep the population stable without considering migration.
- Below 2.1: If the TFR is lower than 2.1, the population might start to decline over time. This is seen in many developed countries like South Korea and Japan.
- Above 2.1: If the TFR is higher than 2.1, the population is likely to grow. This is often the case in many developing countries where families tend to have more children.
India-Fertility rate over the year
| Year | Fertility rate | % change |
|---|---|---|
| 2024 | 1.9823 | -0.82% |
| 2023 | 1.9986 | -0.64% |
| 2022 | 2.0114 | -0.96% |
| 2021 | 2.0308 | -1.00% |
| 2020 | 2.0514 | -2.73% |
| 2019 | 2.109 | -3.10% |
| 2018 | 2.1765 | -1.08% |
| 2017 | 2.2002 | -3.20% |
| 2016 | 2.2729 | -0.60% |
| 2015 | 2.2867 | -0.85% |
| 2014 | 2.3064 | -4.15% |
| 2013 | 2.4062 | -2.45% |
| 2012 | 2.4667 | -2.72% |
| 2011 | 2.5358 | -2.58% |
| 2010 | 2.603 | -2.61% |
| 2009 | 2.6727 | -1.68% |
| 2008 | 2.7184 | -2.35% |
| 2007 | 2.7838 | -2.81% |
| 2006 | 2.8643 | -3.18% |
| 2005 | 2.9584 | -2.89% |
| 2004 | 3.0464 | -2.41% |
| 2003 | 3.1216 | -2.96% |
| 2002 | 3.2169 | -2.60% |
| 2001 | 3.3028 | -1.40% |
| 2000 | 3.3498 | -0.98% |
| 1999 | 3.3831 | -1.83% |
| 1998 | 3.4462 | -1.92% |
| 1997 | 3.5136 | -1.90% |
| 1996 | 3.5816 | -1.90% |
| 1995 | 3.6511 | -1.94% |
| 1994 | 3.7232 | -1.98% |
| 1993 | 3.7986 | -2.03% |
| 1992 | 3.8774 | -2.07% |
| 1991 | 3.9594 | -2.11% |
| 1990 | 4.0446 | -2.13% |
| 1989 | 4.1325 | -2.12% |
| 1988 | 4.2218 | -2.07% |
| 1987 | 4.3111 | -2.00% |
| 1986 | 4.399 | -0.74% |
| 1985 | 4.4316 | -1.87% |
| 1984 | 4.516 | -1.08% |
| 1983 | 4.5651 | -1.19% |
| 1982 | 4.6199 | -1.67% |
| 1981 | 4.6983 | -1.61% |
| 1980 | 4.7753 | -0.67% |
| 1979 | 4.8077 | -1.65% |
| 1978 | 4.8884 | -2.38% |
| 1977 | 5.0074 | -2.39% |
| 1976 | 5.1301 | -1.24% |
| 1975 | 5.1945 | -2.45% |
| 1974 | 5.3248 | -1.44% |
| 1973 | 5.4024 | -1.44% |
| 1972 | 5.4815 | -1.50% |
| 1971 | 5.5647 | -1.05% |
| 1970 | 5.624 | -1.06% |
| 1969 | 5.6842 | -1.31% |
| 1968 | 5.7598 | -1.12% |
| 1967 | 5.8248 | -0.95% |
| 1966 | 5.8806 | -1.02% |
| 1965 | 5.9411 | -0.64% |
| 1964 | 5.9794 | 0.17% |
| 1963 | 5.9691 | 0.27% |
| 1962 | 5.9533 | 0.27% |
| 1961 | 5.937 | 0.27% |
| 1960 | 5.9211 | 0.50% |
| 1959 | 5.8918 | -0.19% |
| 1958 | 5.9031 | -0.17% |
| 1957 | 5.9133 | 0.00% |
| 1956 | 5.9135 | 0.05% |
| 1955 | 5.9106 | 0.08% |
| 1954 | 5.9061 | 0.70% |
| 1953 | 5.8653 | 0.76% |
| 1952 | 5.8211 | 0.85% |
| 1951 | 5.7721 | 0.71% |
| 1950 | 5.7316 |
- In 2024 India’s fertility rate was 1.98 children per women.
- In 1950 India’s fertility rate was 5.73 children per women.
- In 2000 India’s fertility rate was 3.34 children per women.
Fertility rate historical trend

Read also: Fertility rate around the world


