State-Wise Lok Sabha Seats in Indian Parliament (2025)
India’s Lok Sabha, the lower house of Parliament, consists of 543 elected seats. Each seat is represented by a Member of Parliament (MP), chosen directly by the people of India for 5 years during General Elections. Every MP represents a single geographic constituency.
The 543 Lok Sabha seats are distributed among various states and Union Territories. Out of these, 84 seats are reserved for Scheduled Castes (SC) and 47 seats are reserved for Scheduled Tribes (ST) to ensure adequate representation of marginalized communities.
Top 10 states with most Lok Sabha Seats
- Uttar Pradesh(80)
- Maharashtra(48)
- West Bengal(42)
- Bihar(40)
- Tamil Nadu(39)
- Madhya Pradesh(29)
- Rajasthan(25)
- Karnataka(28)
- Gujarat(26)
- Andhra Pradesh(25)
Read also: Total district In India: state wise full list
Indian states Map by Lok Sabha seats
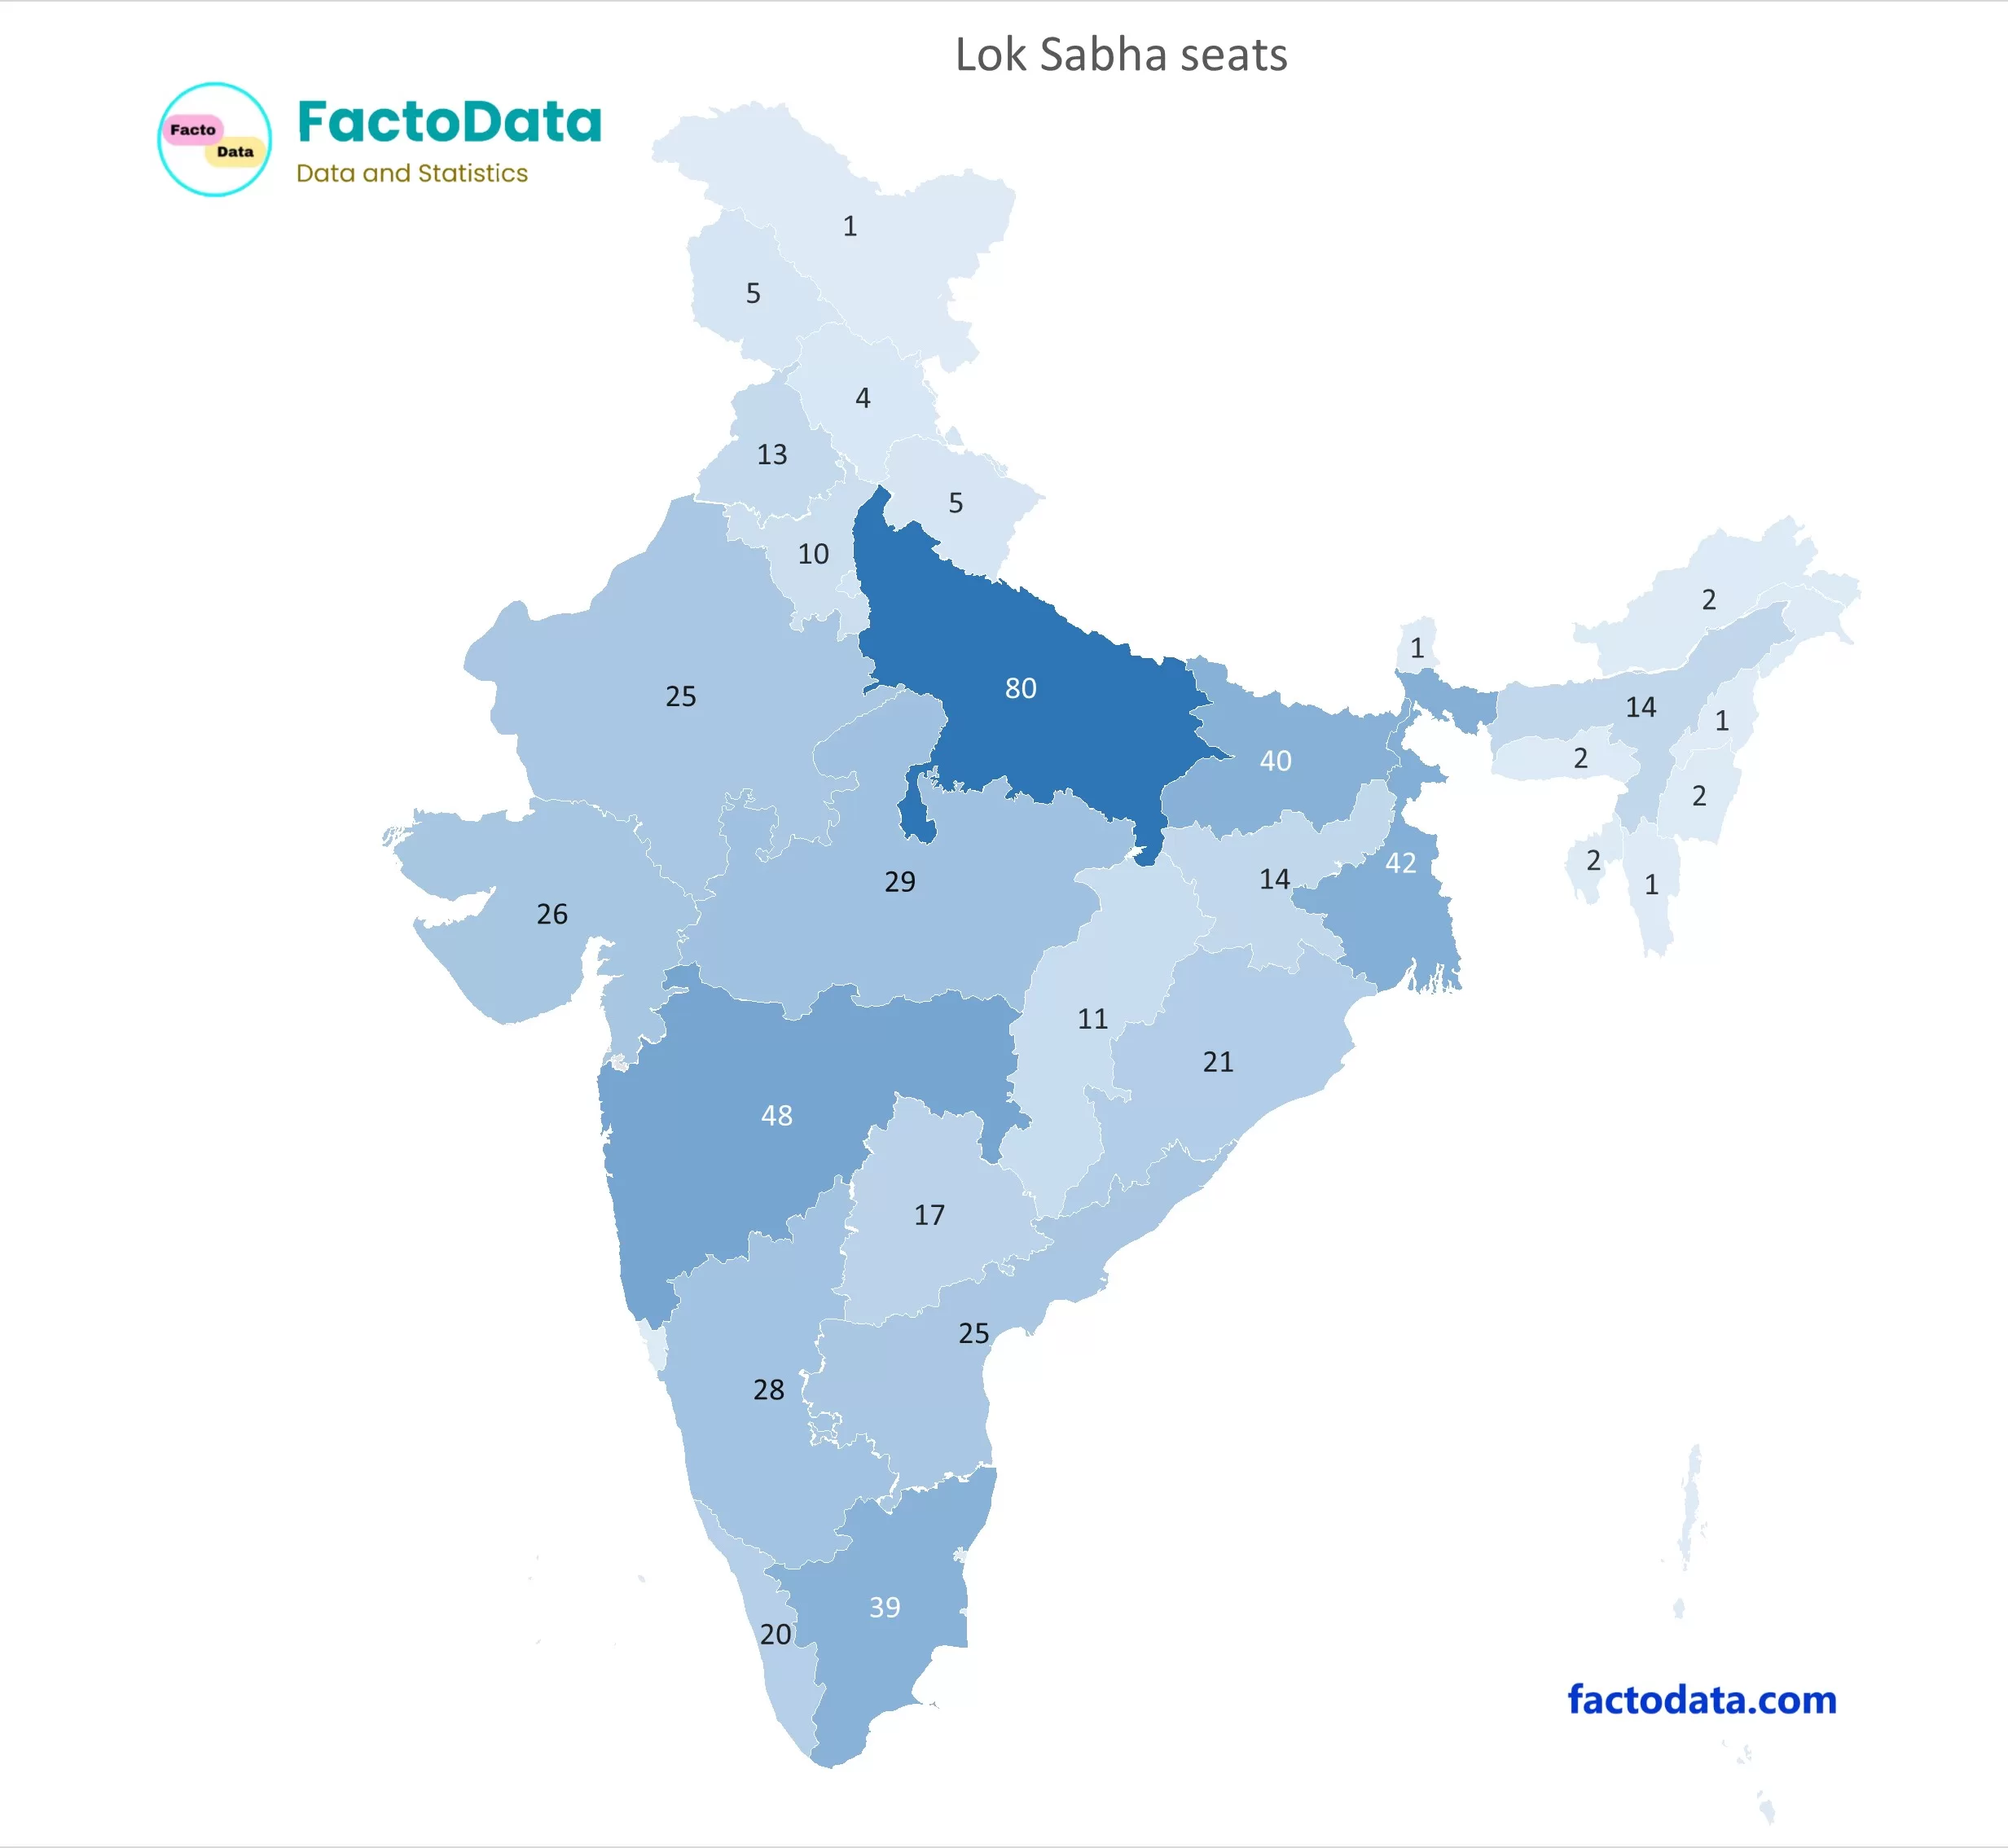
After 2026, the government will likely initiate a new delimitation exercise based on the upcoming Census of India. Consequently, this process could increase the number of Lok Sabha seats to better align representation with the current population data. As a result, states with large populations—such as Uttar Pradesh, Bihar, and Madhya Pradesh—will probably gain additional parliamentary seats.
- Uttar Pradesh has the most number of seats In Lok Sabha.
- Maharashtra has the 2nd highest numbers of seats in Indian Parliament.
List of Indian states By seats In Indian Parliament
| State/ union territory | General | SC | ST | Total | Total (%) |
|---|---|---|---|---|---|
| Andhra Pradesh | 20 | 4 | 1 | 25 | 4.60% |
| Arunachal Pradesh | 2 | - | - | 2 | 0.37% |
| Assam | 11 | 1 | 2 | 14 | 2.58% |
| Bihar | 34 | 6 | - | 40 | 7.37% |
| Chhattisgarh | 6 | 1 | 4 | 11 | 2.03% |
| Goa | 2 | - | - | 2 | 0.37% |
| Gujarat | 20 | 2 | 4 | 26 | 4.79% |
| Haryana | 8 | 2 | - | 10 | 1.84% |
| Himachal Pradesh | 3 | 1 | - | 4 | 0.74% |
| Jharkhand | 8 | 1 | 5 | 14 | 2.58% |
| Karnataka | 21 | 5 | 2 | 28 | 5.16% |
| Kerala | 18 | 2 | - | 20 | 3.68% |
| Madhya Pradesh | 19 | 4 | 6 | 29 | 5.34% |
| Maharashtra | 39 | 5 | 4 | 48 | 8.84% |
| Manipur | 1 | - | 1 | 2 | 0.37% |
| Meghalaya | - | - | 2 | 2 | 0.37% |
| Mizoram | - | - | 1 | 1 | 0.18% |
| Nagaland | 1 | - | - | 1 | 0.18% |
| Odisha | 13 | 3 | 5 | 21 | 3.87% |
| Punjab | 9 | 4 | - | 13 | 2.39% |
| Rajasthan | 18 | 4 | 3 | 25 | 4.60% |
| Sikkim | 1 | - | - | 1 | 0.18% |
| Tamil Nadu | 32 | 7 | - | 39 | 7.18% |
| Telangana | 12 | 3 | 2 | 17 | 3.13% |
| Tripura | 1 | - | 1 | 2 | 0.37% |
| Uttar Pradesh | 63 | 17 | - | 80 | 14.73% |
| Uttarakhand | 4 | 1 | - | 5 | 0.92% |
| West Bengal | 30 | 10 | 2 | 42 | 7.74% |
| Andaman and Nicobar Islands | 1 | - | - | 1 | 0.18% |
| Chandigarh | 1 | - | - | 1 | 0.18% |
| Dadra and Nagar Haveli and Daman and Diu | 1 | - | 1 | 2 | 0.37% |
| Jammu and Kashmir | 5 | - | - | 5 | 0.92% |
| Ladakh | 1 | - | - | 1 | 0.18% |
| Lakshadweep | - | - | 1 | 1 | 0.18% |
| Delhi | 6 | 1 | - | 7 | 1.29% |
| Puducherry | 1 | - | - | 1 | 0.18% |
| Total | 412 | 84 | 47 | 543 | 100% |
Reference:
- https://www.eci.gov.in/term-of-the-houses
- https://www.mea.gov.in/Uploads/PublicationDocs/19167_State_wise_seats_in_Lok_Sabha_18-03-2009.pdf