Why Indians leaving the country: Brain drain from 1960 to 2025
Last Updated on 26.12.2025
More than 600,000 people (6 lakh) left India in 2024, migrating to countries like the United Kingdom (UK), United Arab Emirates (UAE), Canada, Australia, and the United States (US). This trend is often referred to as “brain drain”– a phenomenon where skilled professionals leave their home country in search of better career opportunities, higher wages, and improved living conditions.
Table of Contents
What is Net Migration?
Net migration is defined as the difference between the number of immigrants (people entering a country) and the number of emigrants (people leaving a country). It represents the net total of migration during a specific period and includes both citizens and non-citizens.
Net Migration = Number of Immigrants – Number of Emigrants
Read also: Most Populated cities in India
What is brain drain?
Brain drain is phenomena where highly skilled and educated individual leave their home country to another nations in search of better job opportunities, higher salaries, advanced research facilities, and improved quality of life.
Brain drain in India is significant issue where highly educated students leaving India to countries like USA, Australia, UK, Germany, Canada etc. The impact of brain drain on India includes the loss of talent in critical sectors like healthcare and technology, reduced innovation and R&D capacity, and the economic cost of subsidized education. However, it also brings benefits such as increased remittances and the growing global influence of the Indian diaspora.
Read also: FDI in India (FY14–FY26): Growth Trend, and Key Insights 2025
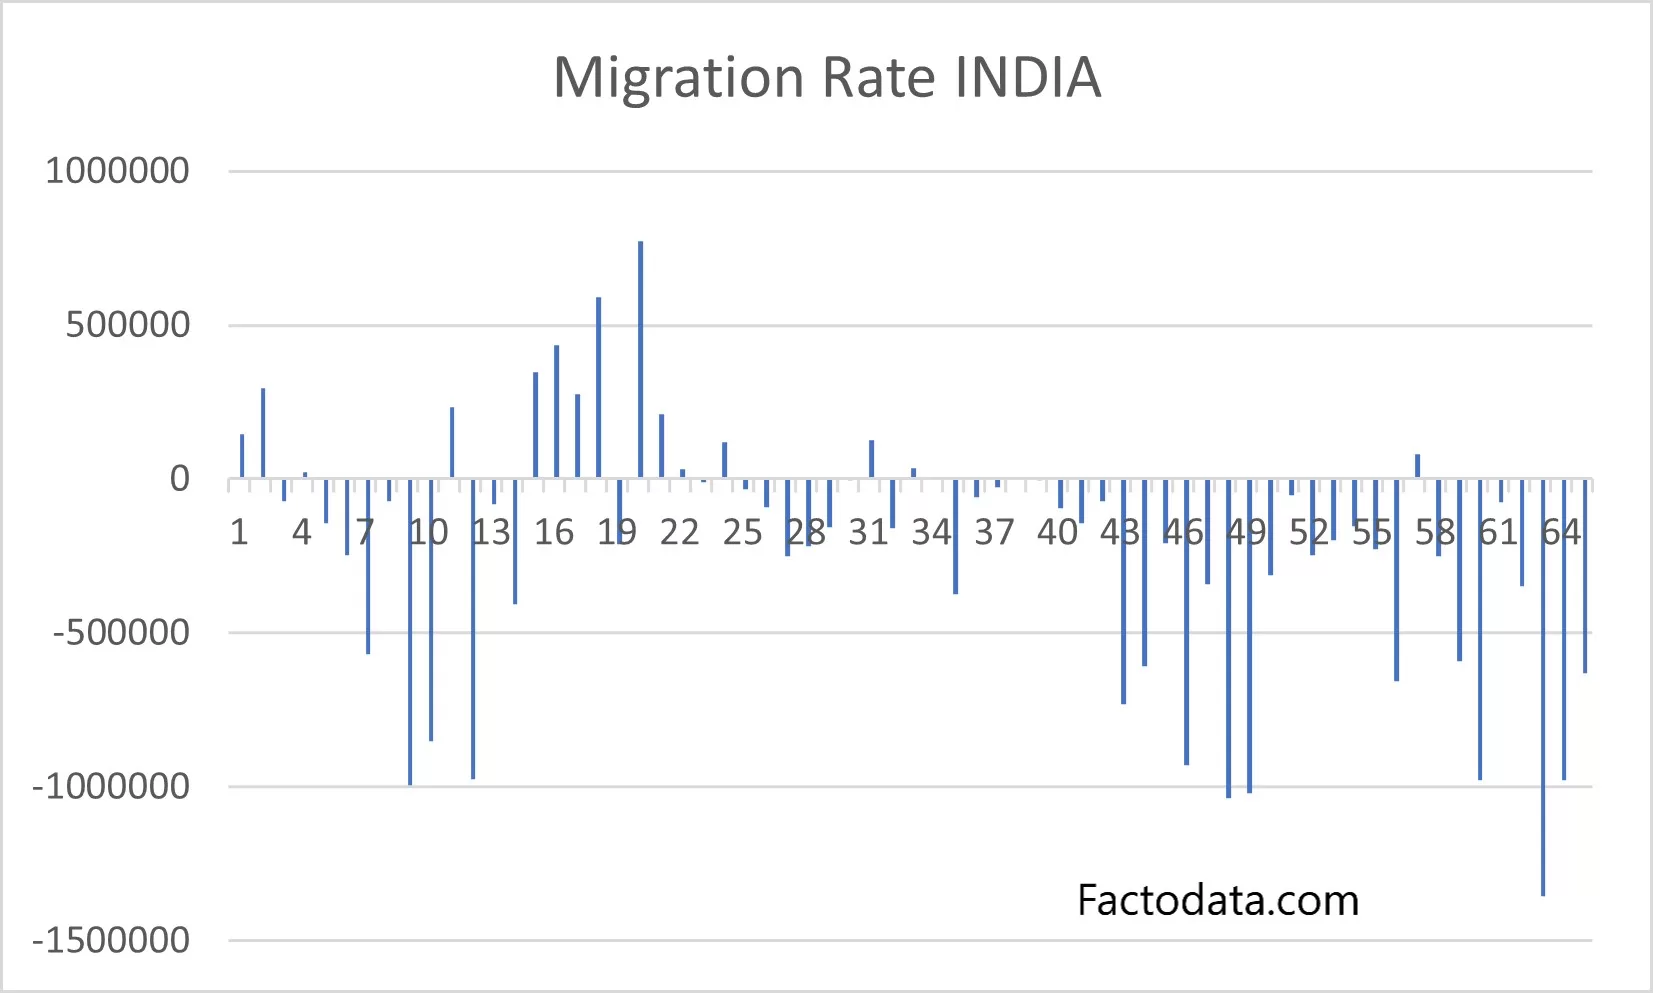
Net Migration rate of India from 1960 to 2025
| Year | Net Migration | % Change |
|---|---|---|
| 1960 | 146955 | |
| 1961 | 295177 | 100.9% |
| 1962 | -70514 | -123.9% |
| 1963 | 21640 | -130.7% |
| 1964 | -141916 | -755.8% |
| 1965 | -248299 | 75.0% |
| 1966 | -566982 | 128.3% |
| 1967 | -70314 | -87.6% |
| 1968 | -995416 | 1315.7% |
| 1969 | -851844 | -14.4% |
| 1970 | 233782 | -127.4% |
| 1971 | -974574 | -516.9% |
| 1972 | -82816 | -91.5% |
| 1973 | -404743 | 388.7% |
| 1974 | 347869 | -185.9% |
| 1975 | 434205 | 24.8% |
| 1976 | 275984 | -36.4% |
| 1977 | 590626 | 114.0% |
| 1978 | -210444 | -135.6% |
| 1979 | 774094 | -467.8% |
| 1980 | 210914 | -72.8% |
| 1981 | 33243 | -84.2% |
| 1982 | -10687 | -132.1% |
| 1983 | 119694 | -1220.0% |
| 1984 | -32313 | -127.0% |
| 1985 | -89991 | 178.5% |
| 1986 | -249545 | 177.3% |
| 1987 | -219150 | -12.2% |
| 1988 | -155676 | -29.0% |
| 1989 | -2907 | -98.1% |
| 1990 | 125514 | -4417.6% |
| 1991 | -157911 | -225.8% |
| 1992 | 35155 | -122.3% |
| 1993 | 2364 | -93.3% |
| 1994 | -375253 | -15973.6% |
| 1995 | -57297 | -84.7% |
| 1996 | -26388 | -53.9% |
| 1997 | 880 | -103.3% |
| 1998 | -1049 | -219.2% |
| 1999 | -95320 | 8986.7% |
| 2000 | -143960 | 51.0% |
| 2001 | -70346 | -51.1% |
| 2002 | -732419 | 941.2% |
| 2003 | -606970 | -17.1% |
| 2004 | -206660 | -66.0% |
| 2005 | -929454 | 349.8% |
| 2006 | -342177 | -63.2% |
| 2007 | -1037200 | 203.1% |
| 2008 | -1020047 | -1.7% |
| 2009 | -312905 | -69.3% |
| 2010 | -50905 | -83.7% |
| 2011 | -247017 | 385.3% |
| 2012 | -198935 | -19.5% |
| 2013 | -151372 | -23.9% |
| 2014 | -227263 | 50.1% |
| 2015 | -655085 | 188.2% |
| 2016 | 81248 | -112.4% |
| 2017 | -251642 | -409.7% |
| 2018 | -589794 | 134.4% |
| 2019 | -978969 | 66.0% |
| 2020 | -73806 | -92.5% |
| 2021 | -348916 | 372.7% |
| 2022 | -1353478 | 287.9% |
| 2023 | -979179 | -27.7% |
| 2024 | -630,830 | -35.6% |
| 2025 |
Source: World Bank
Quick Analysis
- Year 2022 saw the highets brain drain in India with total more then 1.3 Million(13 lacs) people Left India, which is 287% growth from Previous year.
- In 1960-1980 More people came to India then people who left India resulting in net positive migration.
- Indians, especially High Net Worth Individuals (HNWIs) and skilled professionals, are primarily moving to the USA, Canada, Australia, UK, UAE, and Singapore.
Read also: Richest Cities in the World: GDP Rankings in 2025 (Full List)
Where are Indians Going?
High net worth Individuals(HNWI) leaving India to following countries to better lifestyle and living standards. brain
- USA
- Canada
- Australia
- UK
- Italy
- UAE
- Oman
- Singapore
Read also: Life Expectancy in India 2025: Trends, Predictions & Key Factors
Why People are leaving India?
Brain drain India happening due to many reasons. People are leaving India for a mix of economic, social, and lifestyle reasons. It’s not one single cause. migration is usually driven by push factors in India and pull factors abroad.
Better Job Opportunities
Salaries in countries like USA, UK, Germany, Canada etc. is way more higher then in India. the salary gap is huge. A software engineer at an Indian startup might earn well, but the same role at a global tech giant in Silicon Valley offers 3 to 5 times.
Quality of Life & Infrastructure
- People find Cleaner air, better public transport, less noise in Western countries while In India, Air and Noise pollution is worse.
- In India Reliable electricity and water supply is Still out of reach from Large chunk of Population.
- In abroad Safer cities and better civic sense are Normal but in India its rare.
Governance and Corruption
- Abroad, systems are more transparent and predictable while in India its not the case.
- Corruption is rampant in government, which making people lose faith in the system.
- Slow systems, red tape, and corruption frustrate professionals and HNIs.
High Tax – Low Return
Taxes in India are higher than in many countries like the UAE and Singapore, which encourages high-income individuals to leave the country to reduce their tax burden. Despite paying high taxes, many taxpayers do not receive adequate returns in the form of quality public services. Major cities such as Delhi, Mumbai, and Bengaluru continue to struggle with sub-par infrastructure, severe traffic congestion, and high pollution levels.
Read also: GDP of Indian States and UTs in FY 2025
Apart from those India lacking in Education, none of the Indian Unversity features in top 100 rank, Which make abroad Highly suitable for higher studies.
However, not everyone who leaves India is happy, as many face challenges such as visa-related stress, loneliness, being away from family, cultural adjustment difficulties, and lower social acceptance in some Western societies.
Source: World Bank