Decline in fertility rates: A Global Perspective
Total Fertility rate is known as average number of children born to women during their reproductive years. in recent years fertility rate is declining with drastic changes. the effect is more in developed countries like South Korea and Japan.
In 2024 the world’s average fertility rate is 2.3 children per women. which is significant decline from 1950 when it was almost 5 children per woman.
Fertility rate In India, 1950 to 2024
A total fertility rate (TFR) of about 2.1 children per woman is called the “replacement level.” This is the number needed to keep the population stable without considering migration.
- Below 2.1: If the TFR is lower than 2.1, the population might start to decline over time. This is seen in many developed countries like South Korea and Japan.
- Above 2.1: If the TFR is higher than 2.1, the population is likely to grow. This is often the case in many developing countries where families tend to have more children
Total Fertility rate of countries
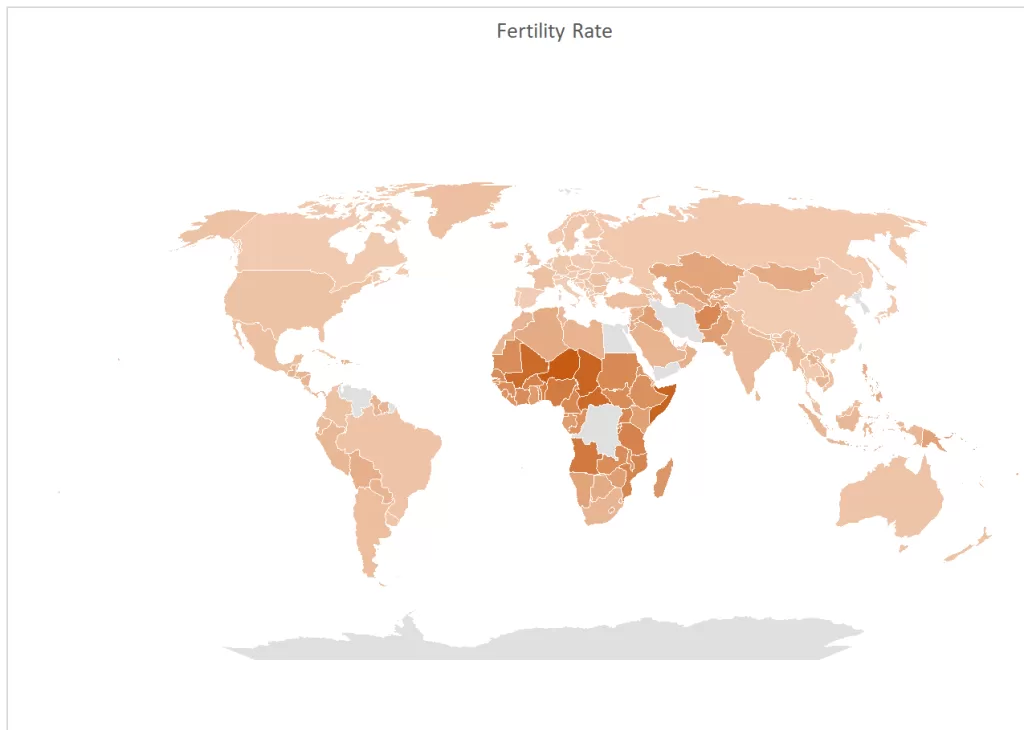
According to World Bank Data, Countries like Niger and Somalia in Africa have some of the world’s highest fertility rates, with averages above 6 children per woman. In contrast, nations such as South Korea and Singapore report some of the lowest fertility rates globally, falling below 1 child per woman.
Highest Fertility rate
| Countries | Fertility Rate (2022) |
|---|---|
| Niger | 6.7 |
| Chad | 6.2 |
| Somalia | 6.2 |
| Congo, Dem. Rep. | 6.1 |
| Central African Republic | 5.9 |
Lowest Fertility rate
| Countries | Fertility Rate(2022) |
|---|---|
| Hong Kong SAR, China | 0.7 |
| South Korea | 0.8 |
| Puerto Rico | 0.9 |
| Palau | 0.9 |
| Singapore | 1.0 |
- Niger has the highest fertility rate in the world at 6.7 children per woman.
- Hong Kong has the lowest fertility rate in the world at 0.7 children per woman.
- Decline in fertility rate since 1990 to 2022 has been highest for Yamen, which has declined from 8.6 to 3.7.

List of countries with Total fertility rate
| SN | Countries | 1990 | 2022 |
|---|---|---|---|
| 1 | Afghanistan | 7.6 | 4.5 |
| 2 | Albania | 2.9 | 1.4 |
| 3 | Algeria | 4.6 | 2.8 |
| 4 | American Samoa | NA | NA |
| 5 | Andorra | NA | NA |
| 6 | Angola | 7.3 | 5.2 |
| 7 | Antigua and Barbuda | 2.2 | 1.6 |
| 8 | Argentina | 3 | 1.9 |
| 9 | Armenia | 2.7 | 1.6 |
| 10 | Aruba | 2.3 | 1.2 |
| 11 | Australia | 1.9 | 1.6 |
| 12 | Austria | 1.5 | 1.4 |
| 13 | Azerbaijan | 2.7 | 1.7 |
| 14 | Bahamas, The | 2.5 | 1.4 |
| 15 | Bahrain | 3.8 | 1.8 |
| 16 | Bangladesh | 4.5 | 2 |
| 17 | Barbados | 1.7 | 1.6 |
| 18 | Belarus | 1.9 | 1.5 |
| 19 | Belgium | 1.6 | 1.5 |
| 20 | Belize | 4.7 | 2 |
| 21 | Benin | 6.7 | 4.9 |
| 22 | Bermuda | 1.7 | 1.3 |
| 23 | Bhutan | 5.6 | 1.4 |
| 24 | Bolivia | 4.9 | 2.6 |
| 25 | Bosnia and Herzegovina | 1.8 | 1.3 |
| 26 | Botswana | 4.5 | 2.8 |
| 27 | Brazil | 2.9 | 1.6 |
| 28 | Brunei Darussalam | 3.3 | 1.8 |
| 29 | Bulgaria | 1.8 | 1.8 |
| 30 | Burkina Faso | 7 | 4.7 |
| 31 | Burundi | 7.4 | 5 |
| 32 | Cabo Verde | 5.4 | 1.9 |
| 33 | Cambodia | 5.6 | 2.3 |
| 34 | Cameroon | 6.4 | 4.4 |
| 35 | Canada | 1.8 | 1.3 |
| 36 | Cayman Islands | NA | NA |
| 37 | Central African Republic | 6 | 5.9 |
| 38 | Chad | 7.2 | 6.2 |
| 39 | Channel Islands | 1.5 | 1.5 |
| 40 | Chile | 2.6 | 1.5 |
| 41 | China | 2.5 | 1.2 |
| 42 | Hong Kong SAR, China | 1.3 | 0.7 |
| 43 | Macao SAR, China | 1.7 | 1.1 |
| 44 | Colombia | 3.1 | 1.7 |
| 45 | Comoros | 6.5 | 3.9 |
| 46 | Congo, Dem. Rep. | 6.7 | 6.1 |
| 47 | Congo, Rep. | 5.2 | 4.1 |
| 48 | Costa Rica | 3.2 | 1.5 |
| 49 | Cote d'Ivoire | 6.7 | 4.3 |
| 50 | Croatia | 1.6 | 1.5 |
| 51 | Cuba | 1.8 | 1.4 |
| 52 | Curacao | 2.3 | 1.3 |
| 53 | Cyprus | 2.4 | 1.3 |
| 54 | Czechia | 1.9 | 1.6 |
| 55 | Denmark | 1.7 | 1.6 |
| 56 | Djibouti | 6 | 2.8 |
| 57 | Dominica | 3 | 1.6 |
| 58 | Dominican Republic | 3.4 | 2.2 |
| 59 | Ecuador | 3.7 | 2 |
| 60 | Egypt, Arab Rep. | 4.5 | 2.9 |
| 61 | El Salvador | 3.9 | 1.8 |
| 62 | Equatorial Guinea | 6 | 4.2 |
| 63 | Eritrea | 6.3 | 3.8 |
| 64 | Estonia | 2.1 | 1.4 |
| 65 | Eswatini | 5.3 | 2.8 |
| 66 | Ethiopia | 7.2 | 4.1 |
| 67 | Faroe Islands | 2.8 | 2 |
| 68 | Fiji | 3.4 | 2.5 |
| 69 | Finland | 1.8 | 1.3 |
| 70 | France | 1.8 | 1.8 |
| 71 | French Polynesia | 3.4 | 1.7 |
| 72 | Gabon | 5.5 | 3.5 |
| 73 | Gambia, The | 6.2 | 4.6 |
| 74 | Georgia | 2.3 | 2.1 |
| 75 | Germany | 1.5 | 1.5 |
| 76 | Ghana | 5.7 | 3.5 |
| 77 | Greece | 1.4 | 1.4 |
| 78 | Greenland | 2.4 | 1.8 |
| 79 | Grenada | 3.5 | 2 |
| 80 | Guam | 3 | 2.6 |
| 81 | Guatemala | 5.5 | 2.4 |
| 82 | Guinea | 6.6 | 4.3 |
| 83 | Guinea-Bissau | 6.5 | 3.9 |
| 84 | Guyana | 3.1 | 2.4 |
| 85 | Haiti | 5.5 | 2.8 |
| 86 | Honduras | 5.3 | 2.3 |
| 87 | Hungary | 1.9 | 1.5 |
| 88 | Iceland | 2.3 | 1.6 |
| 89 | India | 4 | 2 |
| 90 | Indonesia | 3.1 | 2.2 |
| 91 | Iran, Islamic Rep. | 4.9 | 1.7 |
| 92 | Iraq | 5.9 | 3.4 |
| 93 | Ireland | 2.1 | 1.7 |
| 94 | Isle of Man | 1.9 | 1.6 |
| 95 | Israel | 2.8 | 2.9 |
| 96 | Italy | 1.3 | 1.2 |
| 97 | Jamaica | 2.9 | 1.3 |
| 98 | Japan | 1.5 | 1.3 |
| 99 | Jordan | 5.5 | 2.8 |
| 100 | Kazakhstan | 2.7 | 3.1 |
| 101 | Kenya | 6.1 | 3.3 |
| 102 | Kiribati | 4.6 | 3.3 |
| 103 | Korea, Dem. People's Rep. | 2.4 | 1.8 |
| 104 | Korea, Rep. | 1.6 | 0.8 |
| 105 | Kosovo | 3.6 | 1.5 |
| 106 | Kuwait | 3.3 | 2.1 |
| 107 | Kyrgyz Republic | 3.6 | 2.8 |
| 108 | Lao PDR | 6.1 | 2.4 |
| 109 | Latvia | 2 | 1.5 |
| 110 | Lebanon | 3.3 | 2.1 |
| 111 | Lesotho | 4.8 | 3 |
| 112 | Liberia | 6.4 | 4 |
| 113 | Libya | 5 | 2.4 |
| 114 | Liechtenstein | NA | 1.5 |
| 115 | Lithuania | 2 | 1.3 |
| 116 | Luxembourg | 1.6 | 1.3 |
| 117 | Madagascar | 6.2 | 3.8 |
| 118 | Malawi | 6.8 | 3.8 |
| 119 | Malaysia | 3.4 | 1.8 |
| 120 | Maldives | 6.1 | 1.7 |
| 121 | Mali | 7.3 | 5.9 |
| 122 | Malta | 2 | 1.2 |
| 123 | Marshall Islands | 6 | 2.7 |
| 124 | Mauritania | 6.1 | 4.3 |
| 125 | Mauritius | 2.3 | 1.3 |
| 126 | Mexico | 3.5 | 1.8 |
| 127 | Micronesia, Fed. Sts. | 5 | 2.7 |
| 128 | Moldova | 2.4 | 1.8 |
| 129 | Monaco | NA | NA |
| 130 | Mongolia | 4.2 | 2.8 |
| 131 | Montenegro | 1.9 | 1.8 |
| 132 | Morocco | 4 | 2.3 |
| 133 | Mozambique | 6.2 | 4.6 |
| 134 | Myanmar | 3.5 | 2.1 |
| 135 | Namibia | 5.3 | 3.2 |
| 136 | Nepal | 5.2 | 2 |
| 137 | Netherlands | 1.6 | 1.5 |
| 138 | New Caledonia | 3.2 | 2 |
| 139 | New Zealand | 2.2 | 1.7 |
| 140 | Nicaragua | 4.6 | 2.3 |
| 141 | Niger | 7.8 | 6.7 |
| 142 | Nigeria | 6.5 | 5.1 |
| 143 | North Macedonia | 2.2 | 1.6 |
| 144 | Northern Mariana Islands | NA | NA |
| 145 | Norway | 1.9 | 1.4 |
| 146 | Oman | 6.6 | 2.6 |
| 147 | Pakistan | 6.4 | 3.4 |
| 148 | Palau | 2.8 | 0.9 |
| 149 | Panama | 3.1 | 2.3 |
| 150 | Papua New Guinea | 5.2 | 3.2 |
| 151 | Paraguay | 4.5 | 2.4 |
| 152 | Peru | 3.9 | 2.2 |
| 153 | Philippines | 4.4 | 2.7 |
| 154 | Poland | 2.1 | 1.3 |
| 155 | Portugal | 1.6 | 1.4 |
| 156 | Puerto Rico | 2.4 | 0.9 |
| 157 | Qatar | 4.2 | 1.8 |
| 158 | Romania | 1.8 | 1.8 |
| 159 | Russian Federation | 1.9 | 1.4 |
| 160 | Rwanda | 6.9 | 3.7 |
| 161 | Samoa | 4.9 | 3.9 |
| 162 | San Marino | NA | NA |
| 163 | Sao Tome and Principe | 5.8 | 3.8 |
| 164 | Saudi Arabia | 5.8 | 2.4 |
| 165 | Senegal | 6.4 | 4.3 |
| 166 | Serbia | 1.7 | 1.6 |
| 167 | Seychelles | 2.7 | 2.3 |
| 168 | Sierra Leone | 6.6 | 3.9 |
| 169 | Singapore | 1.8 | 1 |
| 170 | Sint Maarten (Dutch part) | 2 | 1.6 |
| 171 | Slovak Republic | 2.1 | 1.6 |
| 172 | Slovenia | 1.5 | 1.6 |
| 173 | Solomon Islands | 5.7 | 3.9 |
| 174 | Somalia | 7.4 | 6.2 |
| 175 | South Africa | 3.7 | 2.3 |
| 176 | South Sudan | 8 | 4.3 |
| 177 | Spain | 1.4 | 1.2 |
| 178 | Sri Lanka | 2.5 | 2 |
| 179 | St. Kitts and Nevis | 2.8 | 1.5 |
| 180 | St. Lucia | 3.4 | 1.4 |
| 181 | St. Martin (French part) | 2.9 | 2.4 |
| 182 | St. Vincent and the Grenadines | 2.8 | 1.8 |
| 183 | Sudan | 6.2 | 4.4 |
| 184 | Suriname | 3.3 | 2.3 |
| 185 | Sweden | 2.1 | 1.5 |
| 186 | Switzerland | 1.6 | 1.4 |
| 187 | Syrian Arab Republic | 5.4 | 2.7 |
| 188 | Tajikistan | 5.3 | 3.1 |
| 189 | Tanzania | 6.2 | 4.7 |
| 190 | Thailand | 2.1 | 1.3 |
| 191 | Timor-Leste | 5.8 | 3 |
| 192 | Togo | 6.1 | 4.2 |
| 193 | Tonga | 4.6 | 3.2 |
| 194 | Trinidad and Tobago | 2.4 | 1.6 |
| 195 | Tunisia | 3.5 | 2.1 |
| 196 | Turkiye | 3.1 | 1.9 |
| 197 | Turkmenistan | 4.2 | 2.6 |
| 198 | Turks and Caicos Islands | 3.4 | 1.7 |
| 199 | Tuvalu | 3.9 | 3.1 |
| 200 | Uganda | 7 | 4.5 |
| 201 | Ukraine | 1.9 | 1.3 |
| 202 | United Arab Emirates | 4.5 | 1.4 |
| 203 | United Kingdom | 1.8 | 1.6 |
| 204 | United States | 2.1 | 1.7 |
| 205 | Uruguay | 2.4 | 1.5 |
| 206 | Uzbekistan | 4.1 | 3.3 |
| 207 | Vanuatu | 5 | 3.7 |
| 208 | Venezuela, RB | 3.4 | 2.2 |
| 209 | Viet Nam | 3.6 | 1.9 |
| 210 | Virgin Islands (U.S.) | 3 | 2 |
| 211 | West Bank and Gaza | 6.8 | 3.4 |
| 212 | Yemen, Rep. | 8.6 | 3.7 |
| 213 | Zambia | 6.5 | 4.2 |
| 214 | Zimbabwe | 4.9 | 3.4 |
| World | 3.3 | 2.3 |
Source: World Bank
Suggestion:
Population growth of India from 1960 to 2024


