
Solar Power capacity of Indian states in 2026
Last Updated: 07 July 2026
Solar power generation capacity in India reached 157.07 GW as of July, 2026, India has become one of the world’s fastest-growing solar energy markets, Solar energy now accounts for the largest share of India’s renewable energy additions and plays a central role in achieving the country’s target of 500 GW of non-fossil fuel capacity by 2030.
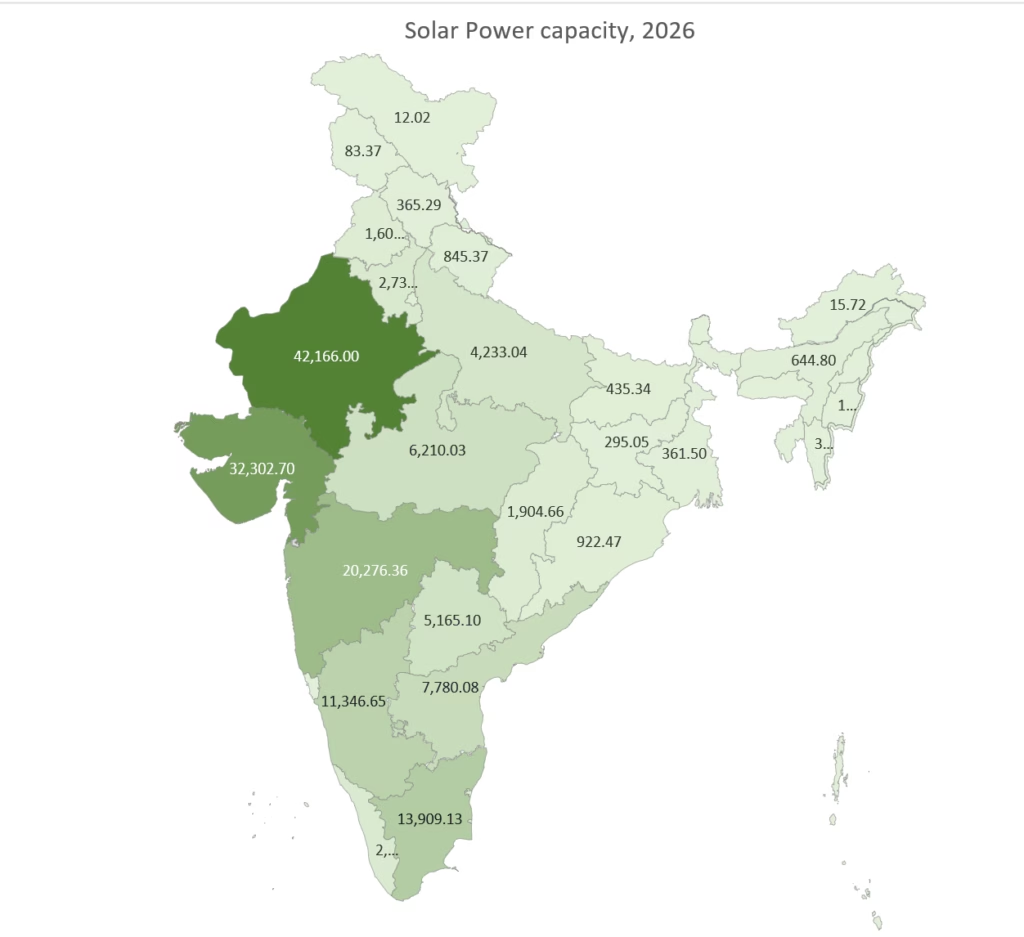
Rajasthan remains India’s largest solar power state with 42.16GW of installed solar capacity, followed by Gujarat, Maharashtra, Karnataka and Tamil Nadu. The generational solar capacity include Ground based plant, Solar rooftop and hybrid projects.
India Solar Power Capacity: Quick Facts (2026)
Key Takeaways
- Rajasthan remained India’s largest solar power state, with installed capacity increasing by 54.18% to 42.17 GW.
- Gujarat recorded one of the largest absolute capacity additions, growing 83.75% to 32.30 GW.
- Maharashtra more than doubled its installed capacity, registering 117.16% growth and moving to third place.
- Assam (241.53%), Dadra & Nagar Haveli and Daman & Diu (198.00%), and Himachal Pradesh (124.79%) recorded the highest percentage growth, albeit from relatively small capacity bases.
- India’s total installed solar power capacity increased from approximately 108.89 GW in 2025 to 157.05 GW in 2026, representing an overall growth of about 44.2%.
Solar Power capacity in India
Cumulative : 157.05 GW
- Ground Mounted Solar Plant : 118.79GW
- Grid Connected Solar Rooftop: 27.88 GW
- Hybrid Projects(Solar Component) : 4.06 GW
- Off-Grid Solar: 6.31 GW
The country has ambitious targets for renewable energy, aiming for 500 GW of non-fossil fuel energy capacity by 2030, with a significant portion expected to come from solar energy.
Top states with highest solar power capacity
| Rank | States | Capacity |
|---|---|---|
| 1 | Rajasthan | 42,166 MW |
| 2 | Gujrat | 32,302 MW |
| 3 | Maharashtra | 20,276 MW |
| 4 | Tamil Nadu | 13,909 MW |
| 5 | Karnataka | 11,346 MW |
Western states like Rajasthan, Gujrat and Maharashtra are leading the way in terms of installed solar power capacity.
Biggest solar power plant in India
The Bhadla Solar Park in Rajasthan is the largest solar power plant in India, with a massive capacity of 2.25 GW. Following Bhadla, the Pavagada Solar Park in Karnataka and the Kurnool Ultra Mega Solar Park in Andhra Pradesh are among the biggest solar parks in India
India has established several large-scale solar parks to encourage investment and development in solar energy.
Ranking of Indian States with solar power capacity
| Rank | State / UT | 2025 (MW) | 2026 (MW) | Annual Growth (%) |
|---|---|---|---|---|
| 1 | Rajasthan | 27,347.80 | 42,166.00 | 54.18% |
| 2 | Gujarat | 17,579.80 | 32,302.70 | 83.75% |
| 3 | Maharashtra | 9,337.04 | 20,276.36 | 117.16% |
| 4 | Tamil Nadu | 9,541.00 | 13,909.13 | 45.78% |
| 5 | Karnataka | 9,289.00 | 11,346.65 | 22.15% |
| 6 | Andhra Pradesh | 4,736.00 | 7,780.08 | 64.28% |
| 7 | Madhya Pradesh | 4,999.80 | 6,210.03 | 24.21% |
| 8 | Telangana | 4,842.00 | 5,165.10 | 6.67% |
| 9 | Uttar Pradesh | 3,356.00 | 4,233.04 | 26.13% |
| 10 | Haryana | 2,015.30 | 2,731.64 | 35.55% |
| 11 | Kerala | 1,351.70 | 2,401.69 | 77.68% |
| 12 | Chhattisgarh | 1,340.50 | 1,904.66 | 42.09% |
| 13 | Punjab | 1,407.00 | 1,603.19 | 13.94% |
| 14 | Odisha | 621.4 | 922.47 | 48.45% |
| 15 | Uttarakhand | 593.1 | 845.37 | 42.53% |
| 16 | Assam | 188.8 | 644.8 | 241.53% |
| 17 | Delhi | 305.9 | 446.2 | 45.86% |
| 18 | Bihar | 317 | 435.34 | 37.33% |
| 19 | West Bengal | 310.6 | 361.5 | 16.39% |
| 20 | Himachal Pradesh | 162.5 | 365.29 | 124.79% |
| 21 | Jharkhand | 199.8 | 295.05 | 47.67% |
| 22 | Dadra & Nagar Haveli and Daman & Diu | 48.12 | 143.4 | 198.00% |
| 23 | Goa | 54.34 | 89.51 | 64.72% |
| 24 | Puducherry | 51.74 | 85.71 | 65.66% |
| 25 | Jammu & Kashmir | 74.49 | 83.37 | 11.92% |
| 26 | Chandigarh | 73.58 | 78.85 | 7.16% |
| 27 | Others | 45.01 | 45.01 | 0.00% |
| 28 | Tripura | 21.24 | 39.76 | 87.19% |
| 29 | Mizoram | 30.39 | 34.4 | 13.20% |
| 30 | Andaman & Nicobar Islands | 29.91 | 32.82 | 9.73% |
| 31 | Manipur | 13.79 | 17.56 | 27.34% |
| 32 | Arunachal Pradesh | 14.85 | 15.72 | 5.86% |
| 33 | Ladakh | 7.8 | 12.02 | 54.10% |
| 34 | Sikkim | 7.56 | 7.56 | 0.00% |
| 35 | Lakshadweep | 4.97 | 6.57 | 32.19% |
| 36 | Meghalaya | 4.28 | 4.28 | 0.00% |
| 37 | Nagaland | 3.17 | 3.58 | 12.93% |
| Total | 100.3 GW | 157.05 GW | 56.58% |
Map of Indian states with solar capacity.
Top 10 States by Installed Solar Capacity (2026)
Solar power capacity has been growing by huge margin on annual basis.