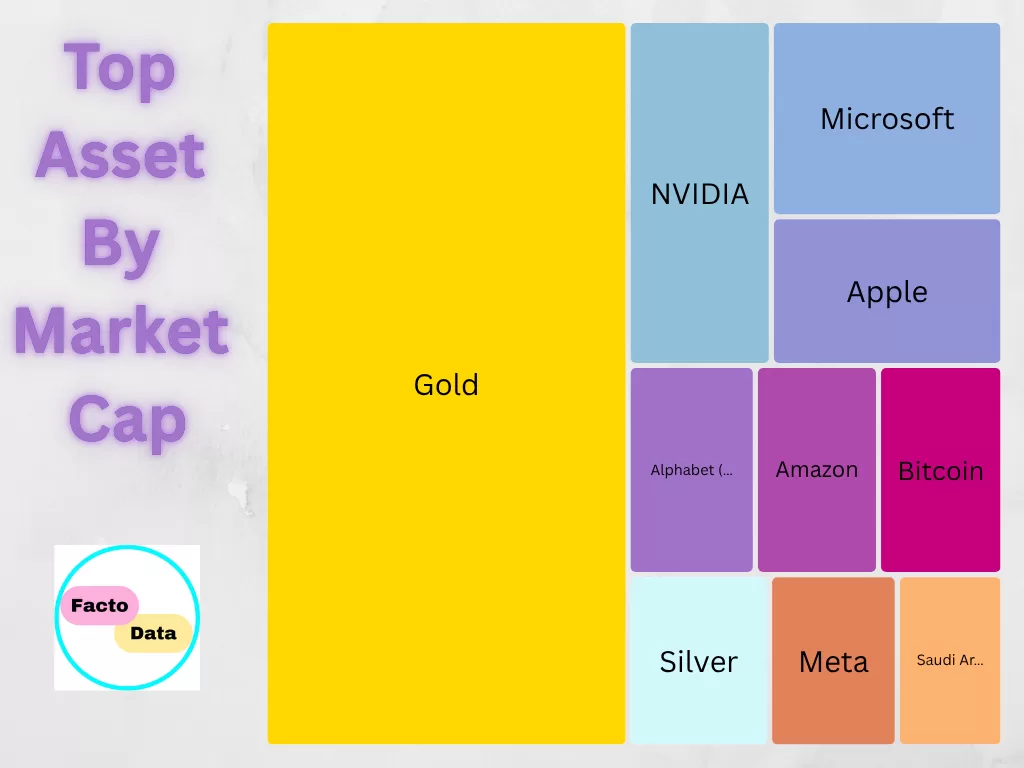
Ranked: Top Assets by Market Cap in 2025
Nvidia is the most valuable company in the world with a market capitalization of $4.3 trillion as of August 2025. But it’s still not the most valuable asset. And no, it’s not Apple, Microsoft, or even Bitcoin. The crown goes to real gold, the most valuable asset in 2025 with an estimated total valuation of $23 trillion globally.
Gold is more valuable than the next 10 assets combined, making it the most sought-after commodity in the world.
Top 5 Asset by Market cap
- Gold
- Nvidia
- Microsoft
- Apple
- Alphabet
Alphabet, Nvidia, Apple, and Microsoft are no longer just companies, their market caps surpass the GDP of most nations, positioning them as dominant global assets in 2025.
Read also: Top 10 Car Manufacturers by Market Cap in 2025: Tesla, Toyota
What Is Market Cap of Asset?
Market cap (short for market capitalization) is the total market value of an asset, whether it’s a company like Nvidia or apple, cryptocurrency like Bitcoin, or commodity like gold and silver.
1. For Companies (like Apple, Microsoft):
Market Cap = Share Price × Total Number of Outstanding Shares
2. For Cryptocurrencies (like Bitcoin):
Market Cap = Current Price per Coin × Total Circulating Supply
For Commodities (like Gold):
Market Cap = Current Price per Unit × Estimated Total Supply
Top Commodities
| Rank | Metal | Market Cap |
|---|---|---|
| 1 | Gold | $23.05 Trillion |
| 2 | Silver | $2.13 Trillion |
| 3 | Platinum | $332.52 Billion |
Most Valued Companies
| Rank | Company | Market Cap |
|---|---|---|
| 1 | NVIDIA | $4.347 Trillion |
| 2 | Microsoft | $3.930 Trillion |
| 3 | Apple | $3.022 Trillion |
| 4 | Alphabet | $2.357 Trillion |
| 5 | Amazon | $2.280 Trillion |
Top Cryptocurrencies
| Rank | Cryptocurrency | Market Cap |
|---|---|---|
| 1 | Bitcoin | $2.260 Trillion |
| 2 | Ethereum | $432.00 Billion |
| 3 | XRP | $175.00 Billion |
List of Top Assets By Market cap in 2025
| Rank | Asset | Market Cap | Country |
|---|---|---|---|
| 1 | Gold | $23.057 T | Global |
| 2 | NVIDIA | $4.347 T | USA |
| 3 | Microsoft | $3.930 T | USA |
| 4 | Apple | $3.022 T | USA |
| 5 | Alphabet (Google) | $2.357 T | USA |
| 6 | Amazon | $2.280 T | USA |
| 7 | Bitcoin | $2.260 T | Global |
| 8 | Silver | $2.130 T | Global |
| 9 | Meta Platforms (Facebook) | $1.922 T | USA |
| 10 | Saudi Aramco | $1.554 T | Saudi Arabia |
| 11 | Broadcom | $1.382 T | USA |
| 12 | TSMC | $1.206 T | Taiwan |
| 13 | Berkshire Hathaway | $1.008 T | USA |
| 14 | Tesla | $999.14 B | USA |
| 15 | JPMorgan Chase | $801.32 B | USA |
| 16 | Walmart | $791.57 B | USA |
| 17 | Oracle | $716.04 B | USA |
| 18 | Eli Lilly | $688.02 B | USA |
| 19 | Visa | $655.43 B | USA |
| 20 | Tencent | $648.57 B | China |
| 21 | SPDR S&P 500 ETF Trust | $577.10 B | ETF |
| 22 | Mastercard | $512.61 B | USA |
| 23 | Netflix | $488.02 B | USA |
| 24 | Exxon Mobil | $456.57 B | USA |
| 25 | Ethereum | $432.00 B | Global |
| 26 | Costco | $419.10 B | USA |
| 27 | Johnson & Johnson | $410.62 B | USA |
| 28 | Palantir | $404.65 B | USA |
| 29 | Home Depot | $383.82 B | USA |
| 30 | ICBC | $359.97 B | China |
Source: Companies Market Cap