Historical Gold Prices in India(1990-2026)
Gold prices have reached historic highs in 2026.. Gold has played a key role in the global financial system for centuries. From backing currencies under the gold standard to serving as a hedge against inflation and economic crises, it remains one of the most closely watched assets in the world.
Gold has been one of the world’s most important investment assets for decades. Since 1950, gold prices in U.S. dollars have moved from a fixed $35 per ounce under the Bretton Woods system to freely traded market prices after the 1971 NIXON shock.
Gold Price in 2026
Gold price as on 20th Feburary 2026.
| Gold type | Price per 10g |
|---|---|
| 24K | ₹1,56,490 |
| 22K | ₹1,43,450 |
| 18K | ₹1,17,370 |
Gold pricing trends in India are influenced by international markets tracked by the World Gold Council, domestic monetary policy from the Reserve Bank of India, and movements in the USD/INR exchange rate.
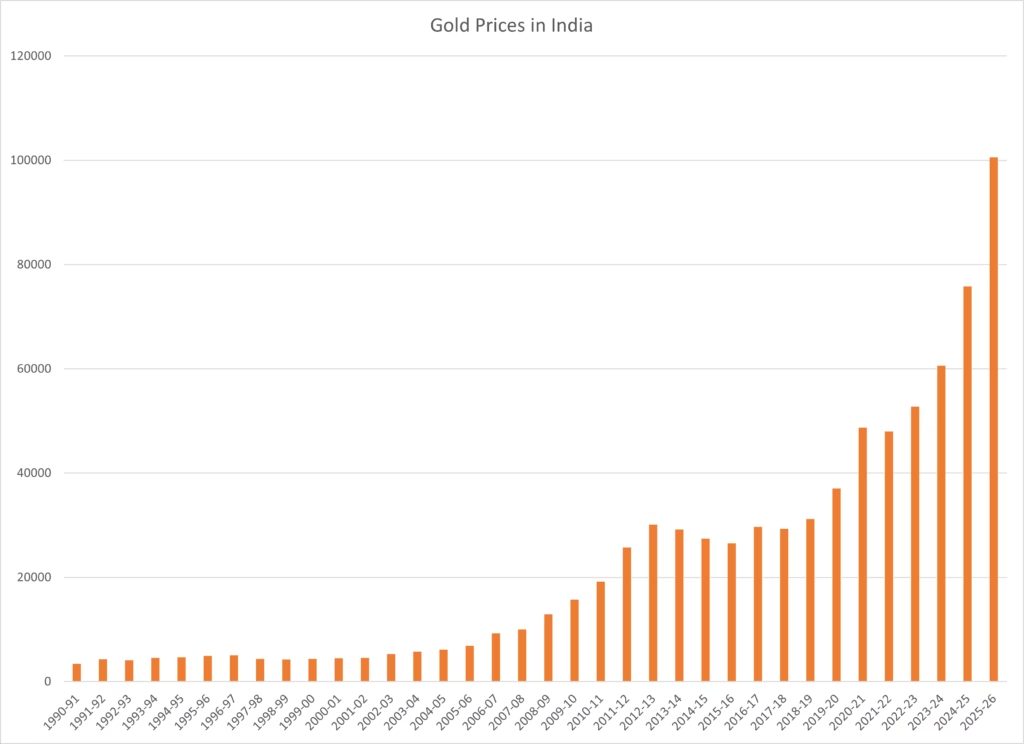
Gold Price in India (1990–2026)
In 1990, gold was priced at ₹3,452 per 10 grams in India. By 2026, it has surged to over ₹1,50,000 per 10 grams.
| Year | Gold Price( INR per 10g) | Annual return |
|---|---|---|
| 1990-91 | 3452 | 7% |
| 1991-92 | 4298 | 25% |
| 1992-93 | 4104 | -5% |
| 1993-94 | 4532 | 10% |
| 1994-95 | 4667 | 3% |
| 1995-96 | 4958 | 6% |
| 1996-97 | 5071 | 2% |
| 1997-98 | 4347 | -14% |
| 1998-99 | 4268 | -2% |
| 1999-00 | 4394 | 3% |
| 2000-01 | 4474 | 2% |
| 2001-02 | 4579 | 2% |
| 2002-03 | 5332 | 16% |
| 2003-04 | 5719 | 7% |
| 2004-05 | 6145 | 7% |
| 2005-06 | 6901 | 12% |
| 2006-07 | 9240 | 34% |
| 2007-08 | 9996 | 8% |
| 2008-09 | 12890 | 29% |
| 2009-10 | 15756 | 22% |
| 2010-11 | 19227 | 22% |
| 2011-12 | 25722 | 34% |
| 2012-13 | 30164 | 17% |
| 2013-14 | 29190 | -3% |
| 2014-15 | 27415 | -6% |
| 2015-16 | 26534 | -3% |
| 2016-17 | 29665 | 12% |
| 2017-18 | 29300 | -1% |
| 2018-19 | 31193 | 6% |
| 2019-20 | 37018 | 19% |
| 2020-21 | 48723 | 32% |
| 2021-22 | 47999 | -1% |
| 2022-23 | 52731 | 10% |
| 2023-24 | 60624 | 15% |
| 2024-25 | 75842 | 25% |
| 2025-26 | 100574* | 33% |
Source: RBI
Note: The prices shown above represent the average gold price for each year.
Major Phases in Gold Prices (1990–2026)
Gold prices have been influenced by global events but have shown a long-term upward trend.
1990-1999: Gradual Growth
Gold prices increased steadily during the 1990s following India’s economic liberalization.
CAGR (1990-1999): 27%
Returns were moderate, with limited volatility compared to later decades.
2000-2011: Strong Bull Market
Gold entered a powerful uptrend between 2000 and 2011. Rising global uncertainty and financial instability drove prices sharply higher.
In India, the rally was amplified by rupee depreciation.
CAGR (2000-2011): 475%
This period delivered some of the highest annual returns in the datas
2012-2018: Correction and Consolidation
After the 2011 peak, gold prices corrected and moved sideways for several years. Annual returns were mixed, with both positive and negative years.
CAGR (2012-2018): 3%
This phase reflects gold’s cyclical nature following strong bull markets.
2019-2026: Record Highs
Gold resumed its upward trend from 2019 onward. Global uncertainty, inflation concerns, and strong domestic demand supported price growth.
By 2026, gold crossed ₹1,50,000 per 10 grams.
CAGR (2019-2026): 172%
Gold Annual Returns in India
Gold’s annual returns vary significantly from year to year. Some years have delivered strong double digit gains, while others have seen corrections.
Key observations from 1990-2026
- Gold has delivered strong long-term appreciation.
- Volatility can be high in the short term.
- Major global events often influence annual returns.
Examining annual return data alongside price trends helps investors understand both growth and risk over time.