GDP of Indian States and UTs in FY 2025
Last Updated: Dec 24, 2025
India is the 5th largest economy in the world, and its economic growth is driven by the performance of its states and union territories (UTs). Understanding the Gross State Domestic Product (GSDP) is essential for policymakers, businesses, investors, and researchers to evaluate regional economic output, growth trends, and development patterns across the country.
This article presents the latest state wise GDP data for India in FY 2025, including rankings, analysis, and key insights based on official sources such as the Reserve Bank of India (RBI). The data has been updated using the most recent official estimates and projections, making this one of the most comprehensive and reliable resources for analyzing the GDP of Indian states and UTs.
Table of Contents
Quick Takeaways
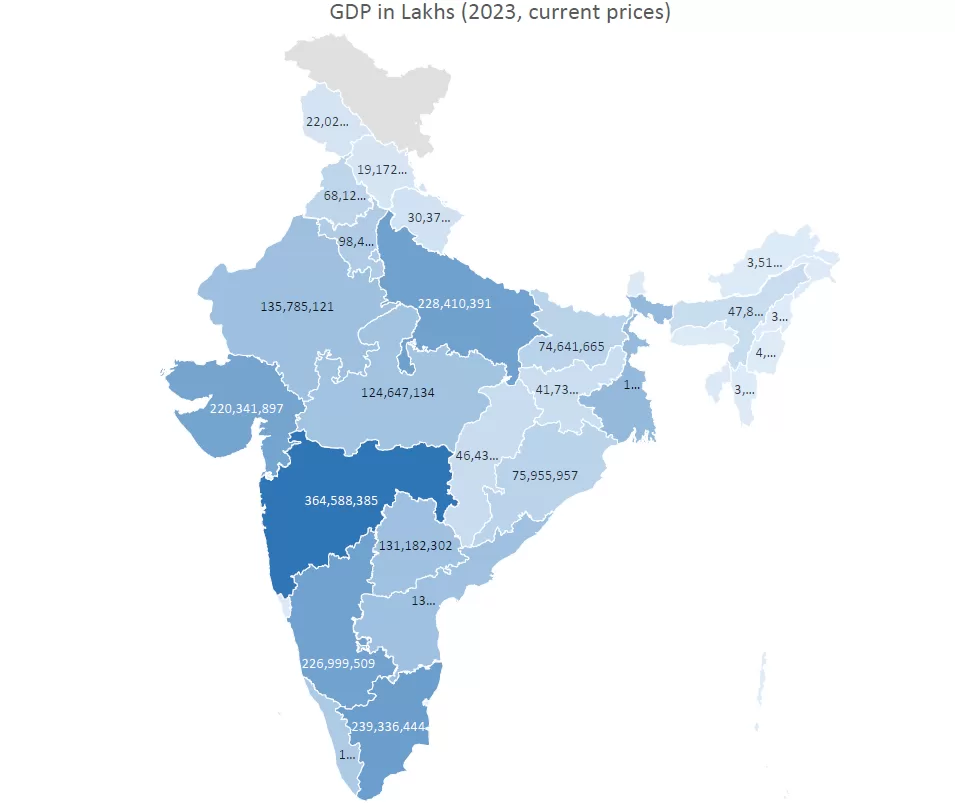
- Maharashtra remains India’s largest state economy in 2025, driven by services, finance, and manufacturing.
- Southern and Western India dominate state wise GDP contribution due to industrialization and services growth.
- Maharashtra Has the highest GSDP followed by Tamil Nadu and Uttar Pradesh.
- All figures are based on the latest RBI reports in FY2025.
What is GDP and Why it matters?
GDP, or Gross Domestic Product, is the total monetary value of all goods and services produced within a country’s borders over a specific period, usually a year or a quarter. It is a key indicator of a country’s economic performance and is used to measure the size and health of an economy.
State GDP data is important because it:
- Measures economic strength and productivity of states.
- Helps compare development levels across regions.
- Guides policy formulation and budget allocation.
- Assists investors in identifying high growth regions.
- Source: RBI
List of Indian states by GDP in 2025
The table below shows the GDP of Indian States and UTs in 2025, measured at current prices (nominal GDP).
| State/UT | GDP in ₹ Crore (2022-23) | GDP in ₹ Crore (2023-24) | GDP in ₹ Crore (2024-25) |
|---|---|---|---|
| Andaman & Nicobar Islands | 11,976.68 | 12,499.11 | - |
| Andhra Pradesh | 1,309,463.97 | 1,422,093.90 | 1,593,061.98 |
| Arunachal Pradesh | 35,711.50 | 38,565.32 | 44,228.69 |
| Assam | 484,984.93 | 569,287.29 | 643,666.69 |
| Bihar | 763,164.72 | 877,196.56 | 991,997.21 |
| Chandigarh | 55,962.74 | 62,535.64 | - |
| Chhattisgarh | 458,891.32 | 512,107.49 | 567,880.43 |
| Delhi | 999,749.39 | 1,112,904.82 | 1,215,003.05 |
| Goa | 93,672.38 | 106,532.57 | - |
| Gujarat | 2,203,418.97 | - | - |
| Haryana | 974,732.33 | 1,085,510.28 | 1,213,951.04 |
| Himachal Pradesh | 192,026.13 | 212,169.43 | 231,690.31 |
| Jammu & Kashmir* | 209,815.52 | 236,058.85 | 262,458.07 |
| Jharkhand | 414,307.68 | 465,638.01 | 516,255.36 |
| Karnataka | 2,319,696.23 | 2,557,241.35 | 2,883,903.23 |
| Kerala | 1,038,734.06 | 1,135,371.56 | 1,248,533.01 |
| Ladakh | 6,564.69 | 8,304.17 | - |
| Madhya Pradesh | 1,221,812.50 | 1,353,808.97 | 1,503,395.40 |
| Maharashtra | 3,641,542.90 | 4,055,847.23 | 4,531,518.42 |
| Manipur | 38,524.31 | 43,413.76 | - |
| Meghalaya | 46,833.80 | 53,223.33 | 59,625.63 |
| Mizoram | 30,184.18 | 33,276.73 | - |
| Nagaland | 35,628.63 | 39,808.65 | - |
| Odisha | 715,262.45 | 798,969.50 | 890,037.54 |
| Puducherry | 42,315.29 | 46,944.98 | 52,162.67 |
| Punjab | 692,519.25 | 771,743.61 | 838,636.61 |
| Rajasthan | 1,356,479.87 | 1,521,509.65 | 1,704,338.55 |
| Sikkim | 42,677.45 | 48,936.94 | - |
| Tamil Nadu | 2,372,469.27 | 2,688,963.32 | 3,118,590.30 |
| Telangana | 1,310,720.67 | 1,461,835.94 | 1,640,901.43 |
| Tripura | 70,633.44 | 79,434.06 | 89,681.81 |
| Uttar Pradesh | 2,295,763.18 | 2,642,877.02 | 2,978,223.51 |
| Uttarakhand | 292,669.94 | 332,997.88 | 378,244.53 |
| West Bengal | 1,515,564.50 | 1,651,373.73 | 1,815,009.91 |
Source: RBI
Top States GDP in 1960 vs 2023
| Rank in 1960 | State | Share in India’s GDP (%)(1960) | Rank in 2023 |
|---|---|---|---|
| 1 | Uttar Pradesh | 14.4 | 3 |
| 2 | Maharashtra | 12.5 | 1 |
| 3 | West Bengal | 10.5 | 6 |
| 4 | Tamil Nadu | 8.7 | 2 |
| 5 | Bihar | 7.8 | 15 |
Source: RBI
Quick Analysis
- Uttar Pradesh ranked 1st in 1960 with a 14.4% share in India’s GDP, By 2023, it dropped to 3rd place, indicating a relative decline.
- Maharashtra ranked 2nd in 1960 with a 12.5% GDP share it rose to 1st place in 2023, becoming India’s top economic contributor.
- West Bengal held 3rd place in 1960 with a 10.5% GDP share which fall significantly to 6th by 2023, reflecting slower economic growth.
- Tamil Nadu was 4th in 1960 with an 8.7% GDP share. it climbed to 2nd position in 2023 due to consistent growth.
- Bihar ranked 5th in 1960 with a 7.8% GDP share. dropped sharply to 15th in 2023, signaling major economic value reduction.
Top 5 states by GDP
The following states are the largest contributors to India’s economy in FY 2025
Maharashtra
Maharashtra is India’s largest state economy in 2025, driven primarily by the services sector, financial activities, manufacturing, and trade. Mumbai, the country’s financial capital, plays a central role through banking, capital markets, media, and corporate headquarters, while industrial hubs across the state support manufacturing and exports. Pune, Nashik and Nagpur are other Economic hubs in state. Mumbai has one of the biggest port in India.
Tamil Nadu
Tamil Nadu ranks among the top contributors to India’s GDP due to its diversified industrial base. The state is a major center for automobile manufacturing, electronics, textiles, and exports, supported by strong infrastructure, skilled labor, and port connectivity.
Uttar Pradesh
Uttar Pradesh has emerged as one of the fastest growing large state economies in India. Its GDP growth is supported by large scale infrastructure projects, industrial corridors, manufacturing expansion, and a rapidly growing consumer market driven by its large population. Noida, Lucknow, Kanpur are its biggest Economic hubs. tourism also Ha significant contribution to its economy.
Karnataka
Karnataka’s economy is largely powered by the technology and services sector, with Bengaluru serving as India’s leading IT and startup hub. In addition to software and digital services, the state also benefits from manufacturing, biotechnology, and research-driven industries.
Gujrat
Gujarat remains one of India’s most industrialized states, with GDP growth driven by manufacturing, petrochemicals, ports, and exports. The state’s strong logistics network, business-friendly policies, and industrial clusters contribute significantly to its economic performance.
FAQs
-
Which Indian state has the highest GDP in 2025?
Maharashtra is the largest state economy in India by GDP in 2025.
-
What is the difference between GDP and GSDP?
GDP refers to the national economy, while GSDP measures economic output at the state level.
-
How often is state GDP data updated?
State GDP figures are released annually by state governments and compiled by central agencies.
Sources
- RBI
- Ministry of Statistics and Programme Implementation (MOSPI)
- https://eacpm.gov.in/wp-content/uploads/2024/09/State-GDP-Working-Paper_Final.pdf