How Poverty in India Has Declined Sharply in Recent Decades
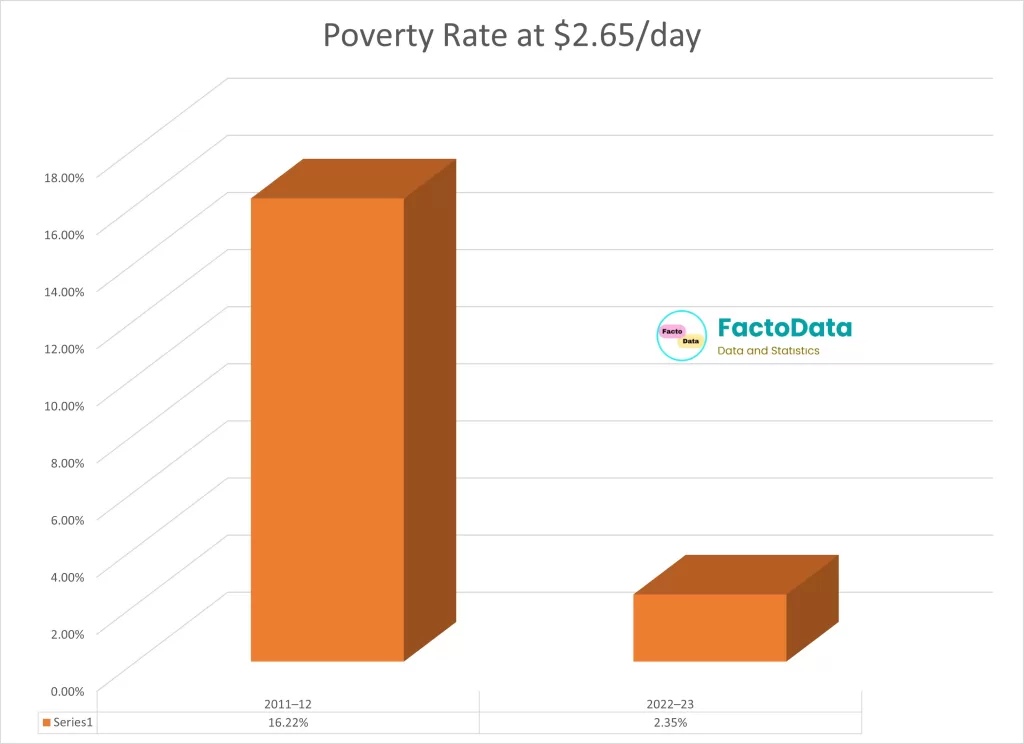
Extreme Poverty in India has reduced drastically over the past decade. According to the latest World Bank report, approximately 171 million people have been lifted out of extreme poverty. The proportion of people living on less than $2.15 per day-the international benchmark for extreme poverty-fell sharply from 16.2% in 2011-12 to just 2.3% in 2022-23.
This progress is visible across both rural and urban regions. Rural poverty declined from 18.4% to 2.8%, while urban poverty dropped from 10.7% to 1.1% during the same period.
International Poverty Lines
- International Extreme Poverty Line: $2.15 per day (2017 PPP); used globally to define extreme poverty.
- Revised International Extreme Poverty Line: $3.00 per day (2021 PPP); used globally to define extreme poverty.
- Lower-Middle-Income Poverty Line: $3.65 per day (2017 PPP); reflects lower-middle-income group thresholds.
- Upper-Middle-Income Poverty Line: $6.85 per day (2017 PPP); used to measure poverty in upper-middle-income countries.
Poverty Rate
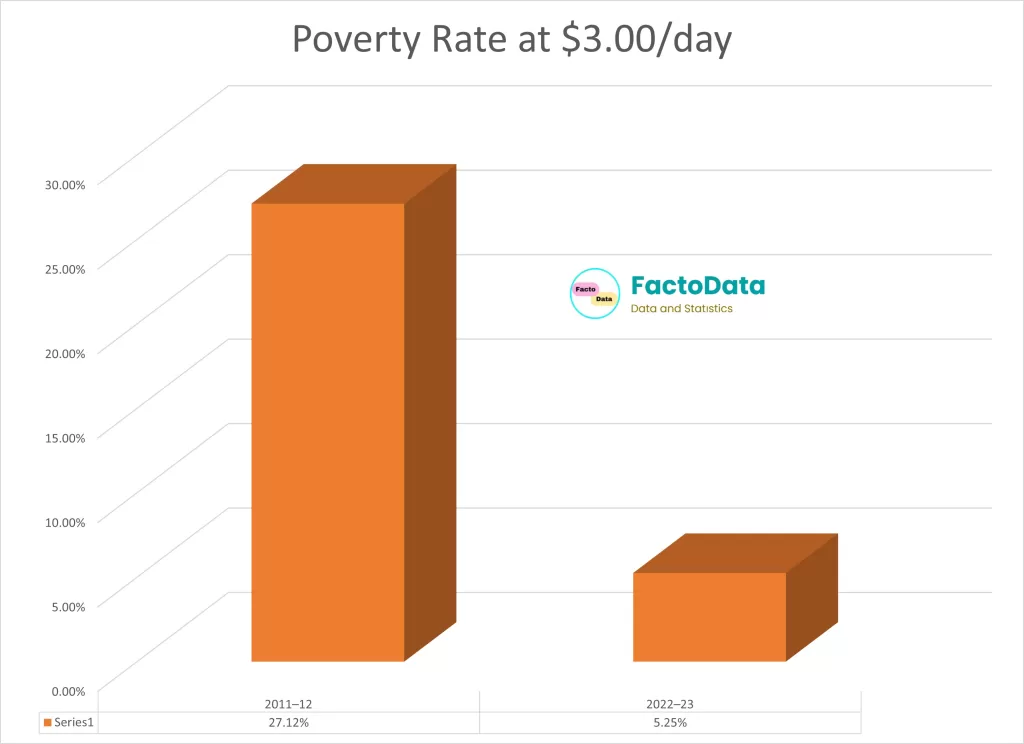
The World Bank also highlights the revised Poverty rate (2021 PPP) which is $3.00/day, at this line the poverty has reduced from 27.12% in 2011-12 to 5.25% in 2022-23.
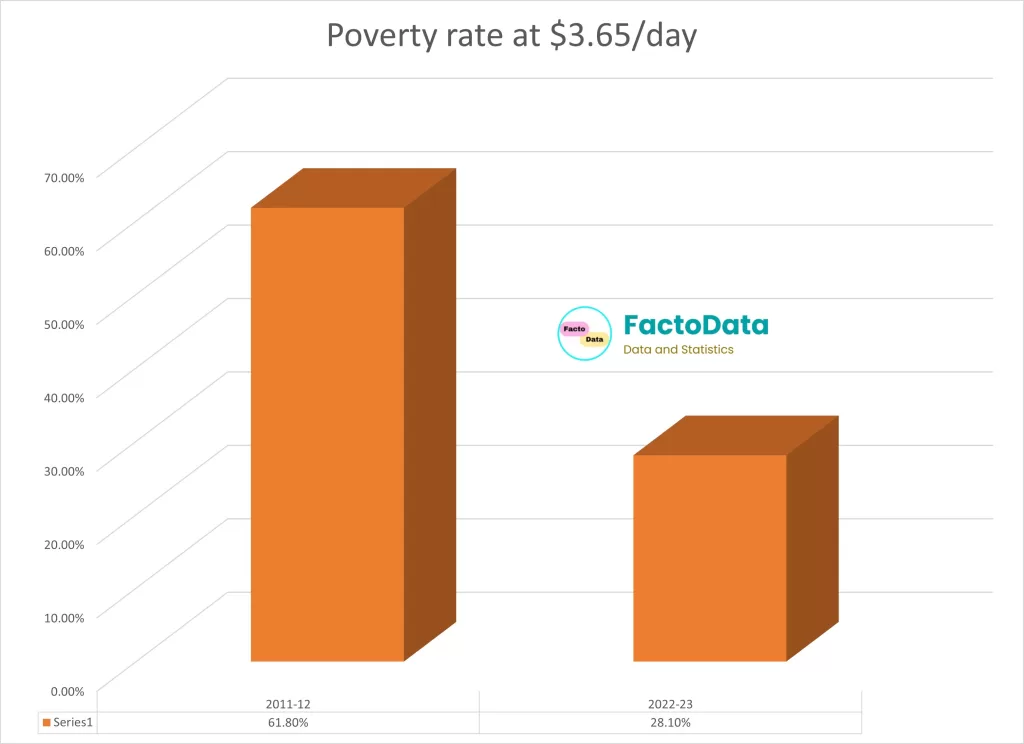
India’s poverty rate at the $3.65 per day poverty line-which reflects the lower middle income threshold, fell sharply from 61.8% in 2011-12 to 28.1% in 2022-23, lifting an estimated 378 million people out of poverty.
- In rural India, poverty declined from 69% to 32.5%.
- In urban areas, poverty fell from 43.5% to 17.2%.
The rural-urban poverty gap also narrowed significantly, shrinking from 25 to 15 percentage points. Overall, India achieved an average annual poverty reduction rate of 7% during this period-one of the fastest globally at this scale.
Poverty in India
| Year | Poverty Line (PPP/day) | Poverty Rate | People Below Poverty Line |
|---|---|---|---|
| 2011–12 | $2.15 (2017) | 16.22% | ~205.9 million |
| 2011–12 | $3.00 (2021) | 27.12% | ~344.47 million |
| 2011-12 | $3.65 (2017) | 61.8% | ~778.7 million |
| 2022–23 | $2.15 (2017) | 2.35% | ~33.6 million |
| 2022–23 | $3.00 (2021) | 5.25% | ~75.2 million |
| 2022-23 | $3.65 (2017) | 28.1% | ~400.7 million |
India’s five biggest states-Uttar Pradesh, Maharashtra, Bihar, West Bengal, and Madhya Pradesh-had 65% of the country’s extreme poor in 2011-12. By 2022-23, they helped reduce two-thirds of India’s extreme poverty. But even now, these states still have 54% of the extremely poor and 51% of the multidimensionally poor, based on the Multidimensional Poverty Index.
Sources: